www.ringenergy.com NYSE American: REI RING ENERGY PROPSED ACQUISITION OF FOUNDERS OIL & GAS PROPOSED TRANSACTION SUMMARY July 11, 2023 PROPOSED ACCRETIVE ACQUISITION EXPANDS CORE OPERATING AREA
www.ringenergy.com NYSE American: REI2 Forward-Looking Statements and Cautionary Notes 2 This Presentation includes "forward-looking statements" within the meaning of the Private Securities Litigation Reform Act of 1995, Section 27A of the Securities Act of 1933, as amended, and Section 21E of the Securities Exchange Act of 1934, as amended. All statements, other than statements of strictly historical facts included in this Presentation constitute forward-looking statements and may often, but not always, be identified by the use of such words as “may,” “will,” “should,” “could,” “intends,” “estimates,” “expects,” “anticipates,” “plans,” “project,” “guidance,” “target,” “potential,” “possible,” “probably,” and “believes” or the negative variations thereof or comparable terminology. These forward-looking statements include statements regarding the expected benefits to the Company and its stockholders from the proposed acquisition of oil and gas properties (the “Founders Acquisition”) from Founders Oil & Gas IV, LLC; and the Company's financial position, future revenues, net income, potential evaluations, business strategy, revenues, earnings, costs, capital expenditures and debt levels of the Company, and plans and objectives of management for future operations. Forward-looking statements are based on current expectations and subject to numerous assumptions, risks and uncertainties that may cause actual results to be materially different than any future results expressed or implied in those statements. However, whether actual results and developments will conform to expectations is subject to a number of material risks and uncertainties, including but not limited to: the Company’s ability to successfully integrate the oil and gas properties acquired in the Founders Acquisition; declines in oil, natural gas liquids or natural gas prices; the level of success in exploration, development and production activities; adverse weather conditions that may negatively impact development or production activities; the timing of exploration and development expenditures; inaccuracies of reserve estimates or assumptions underlying them; revisions to reserve estimates as a result of changes in commodity prices or production history; impacts to financial statements as a result of impairment write-downs; risks related to the level of indebtedness and periodic redeterminations of the borrowing base under the Company’s credit facility; the impacts of hedging on results of operations; the Company’s ability to replace oil and natural gas reserves; any loss of senior management or technical personnel; and the direct and indirect impact on most or all of the foregoing due to the COVID-19 pandemic or future variants. Some of the factors that could cause actual results to differ materially from expected results are subject to certain risks and uncertainties which are described under “Risk Factors” in the Company’s 2022 annual report on Form 10-K filed with the U.S. Securities and Exchange Commission (“SEC”) on March 9, 2023 and the Company’s other SEC filings. Although the Company believes that the assumptions upon which such forward-looking statements are based are reasonable, it can give no assurance that such assumptions will prove to be correct. All forward-looking statements in this Presentation are expressly qualified by the cautionary statements and by reference to the underlying assumptions that may prove to be incorrect. The Company undertakes no obligation to publicly revise these forward-looking statements to reflect events or circumstances that arise after the date hereof, except as required by applicable law. The financial and operating estimates contained in this Presentation represent our reasonable estimates as of the date of this Presentation. Neither our independent auditors nor any other third party has examined, reviewed or compiled the projections and, accordingly, none of the foregoing expresses an opinion or other form of assurance with respect thereto. The assumptions upon which the projections are based are described in more detail herein. Some of these assumptions inevitably will not materialize, and unanticipated events may occur that could affect our results. Therefore, our actual results achieved during the periods covered by the estimates will vary from the projected results. Prospective investors are cautioned not to place undue reliance on the estimates included herein.
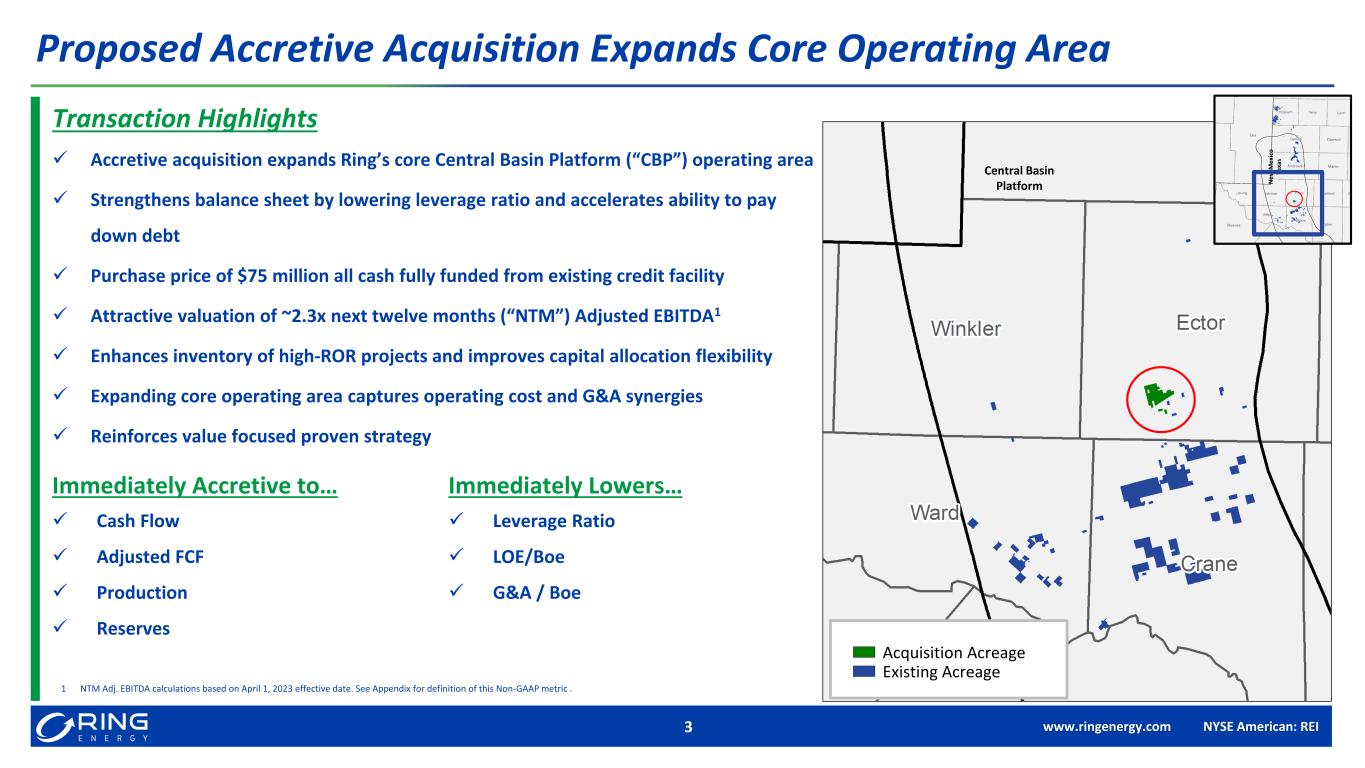
www.ringenergy.com NYSE American: REI3 Proposed Accretive Acquisition Expands Core Operating Area Acquisition Acreage Existing Acreage N e w M e xi co Te xa s Transaction Highlights ✓ Accretive acquisition expands Ring’s core Central Basin Platform (“CBP”) operating area ✓ Strengthens balance sheet by lowering leverage ratio and accelerates ability to pay down debt ✓ Purchase price of $75 million all cash fully funded from existing credit facility ✓ Attractive valuation of ~2.3x next twelve months (“NTM”) Adjusted EBITDA1 ✓ Enhances inventory of high-ROR projects and improves capital allocation flexibility ✓ Expanding core operating area captures operating cost and G&A synergies ✓ Reinforces value focused proven strategy Immediately Accretive to… ✓ Cash Flow ✓ Adjusted FCF ✓ Production ✓ Reserves Immediately Lowers… ✓ Leverage Ratio ✓ LOE/Boe ✓ G&A / Boe 1 NTM Adj. EBITDA calculations based on April 1, 2023 effective date. See Appendix for definition of this Non-GAAP metric . Central Basin Platform Acquisition Acreage Existing Acreage
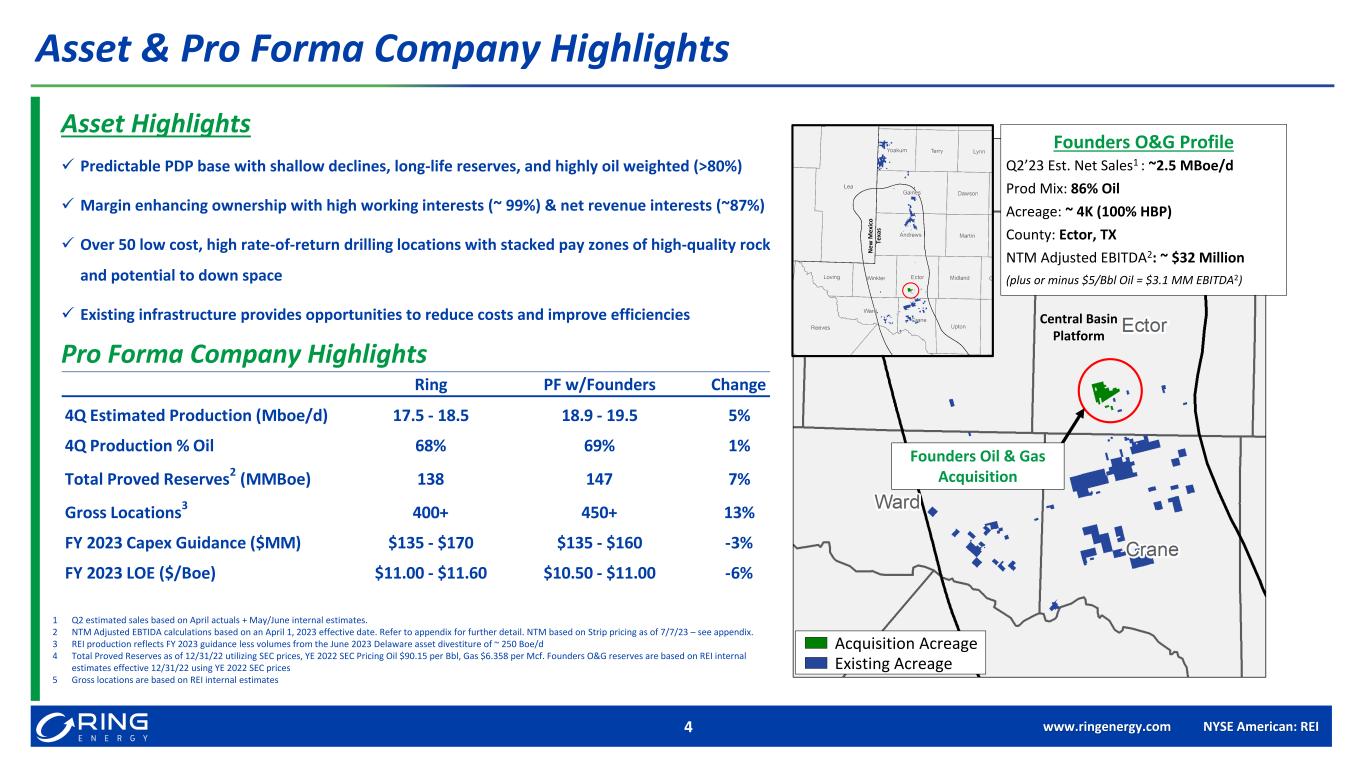
www.ringenergy.com NYSE American: REI Founders Oil & Gas Acquisition Central Basin Platform N e w M e xi co Te xa s 4 Asset & Pro Forma Company Highlights Founders O&G Profile Q2’23 Est. Net Sales1 : ~2.5 MBoe/d Prod Mix: 86% Oil Acreage: ~ 4K (100% HBP) County: Ector, TX NTM Adjusted EBITDA2: ~ $32 Million (plus or minus $5/Bbl Oil = $3.1 MM EBITDA2) 1 Q2 estimated sales based on April actuals + May/June internal estimates. 2 NTM Adjusted EBTIDA calculations based on an April 1, 2023 effective date. Refer to appendix for further detail. NTM based on Strip pricing as of 7/7/23 – see appendix. 3 REI production reflects FY 2023 guidance less volumes from the June 2023 Delaware asset divestiture of ~ 250 Boe/d 4 Total Proved Reserves as of 12/31/22 utilizing SEC prices, YE 2022 SEC Pricing Oil $90.15 per Bbl, Gas $6.358 per Mcf. Founders O&G reserves are based on REI internal estimates effective 12/31/22 using YE 2022 SEC prices 5 Gross locations are based on REI internal estimates Acquisition Acreage Existing Acreage Asset Highlights ✓ Predictable PDP base with shallow declines, long-life reserves, and highly oil weighted (>80%) ✓ Margin enhancing ownership with high working interests (~ 99%) & net revenue interests (~87%) ✓ Over 50 low cost, high rate-of-return drilling locations with stacked pay zones of high-quality rock and potential to down space ✓ Existing infrastructure provides opportunities to reduce costs and improve efficiencies Pro Forma Company Highlights Ring PF w/Founders Change 4Q Estimated Production (Mboe/d) 17.5 - 18.5 18.9 - 19.5 5% 4Q Production % Oil 68% 69% 1% Total Proved Reserves 2 (MMBoe) 138 147 7% Gross Locations 3 400+ 450+ 13% FY 2023 Capex Guidance ($MM) $135 - $170 $135 - $160 -3% FY 2023 LOE ($/Boe) $11.00 - $11.60 $10.50 - $11.00 -6%
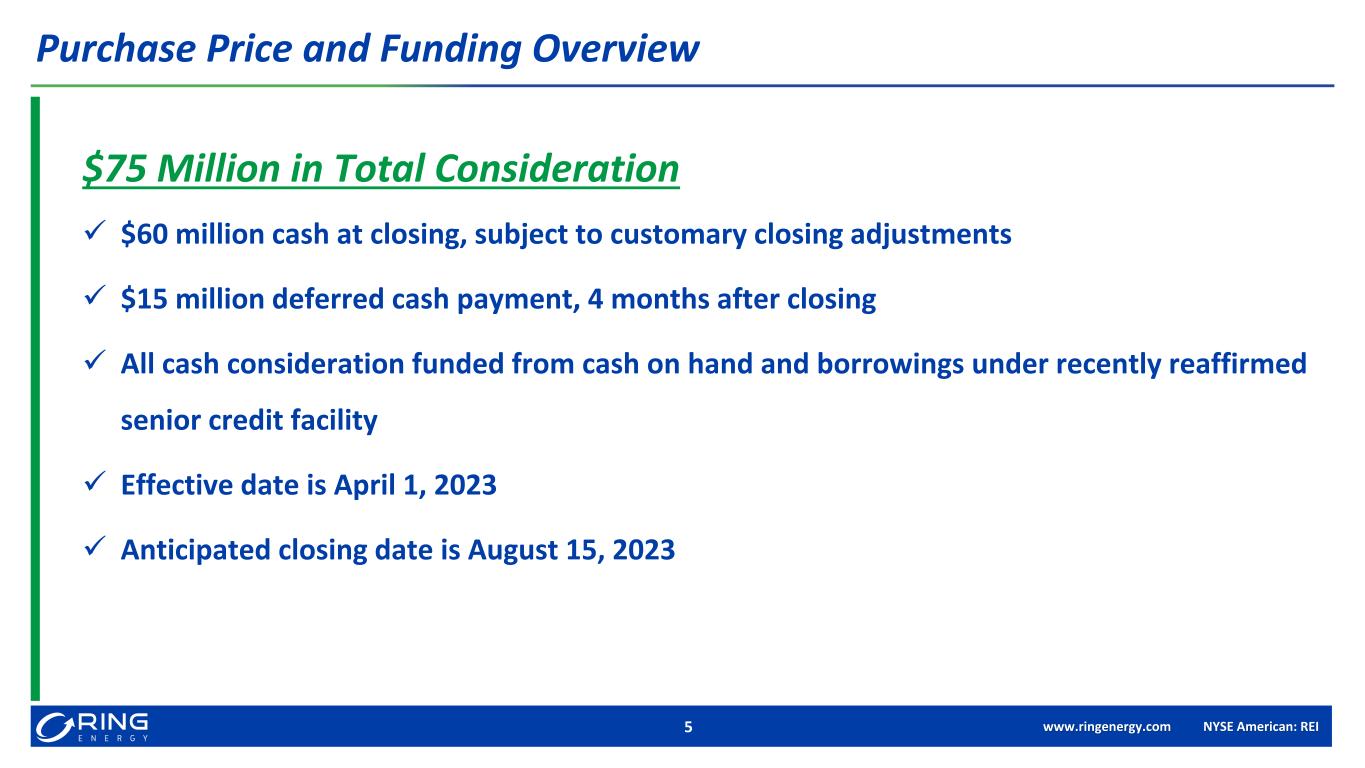
www.ringenergy.com NYSE American: REI5 Purchase Price and Funding Overview $75 Million in Total Consideration ✓ $60 million cash at closing, subject to customary closing adjustments ✓ $15 million deferred cash payment, 4 months after closing ✓ All cash consideration funded from cash on hand and borrowings under recently reaffirmed senior credit facility ✓ Effective date is April 1, 2023 ✓ Anticipated closing date is August 15, 2023
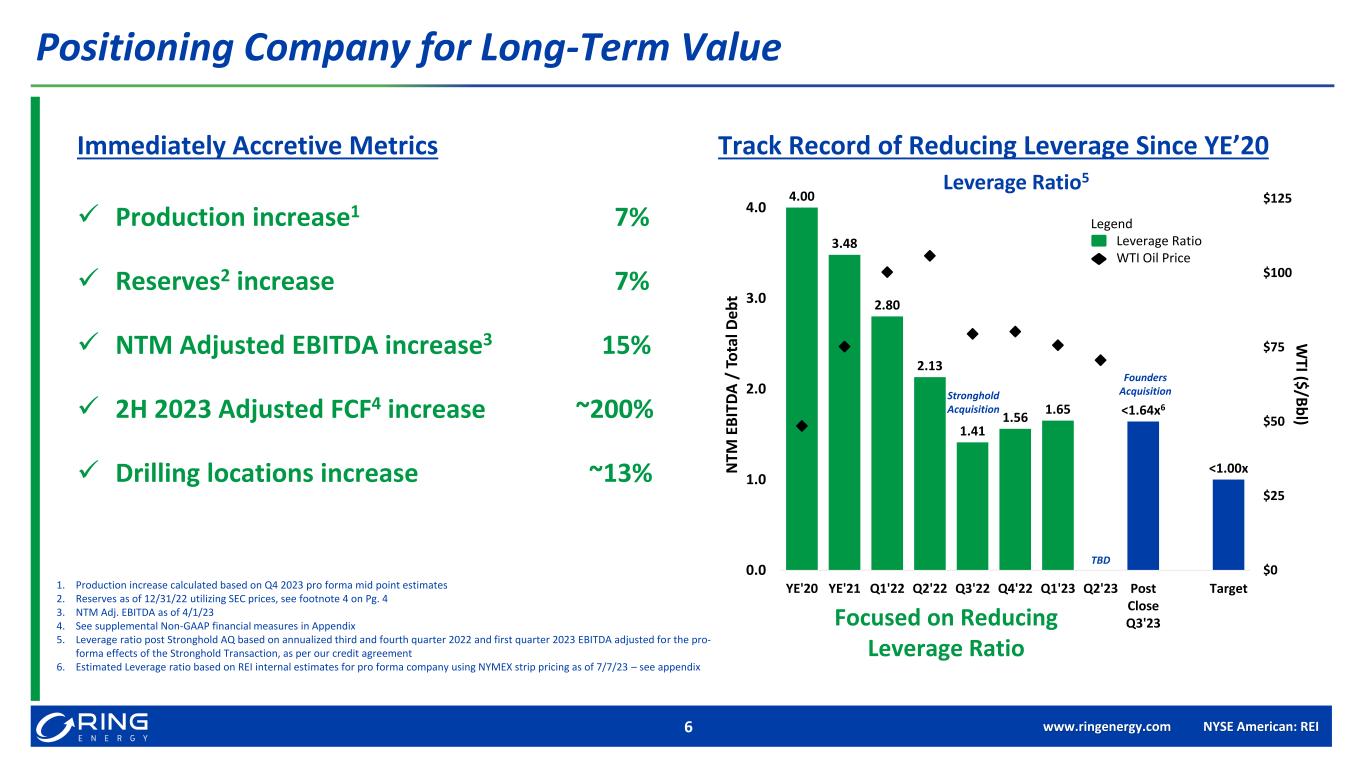
www.ringenergy.com NYSE American: REI6 Positioning Company for Long-Term Value 4.00 3.48 2.80 2.13 1.41 1.56 1.65 <1.64x6 <1.00x $0 $25 $50 $75 $100 $125 0.0 1.0 2.0 3.0 4.0 YE'20 YE'21 Q1'22 Q2'22 Q3'22 Q4'22 Q1'23 Q2'23 Post Close Q3'23 Target W TI ($ /B b l) N TM E B IT D A / T o ta l D e b t Leverage Ratio5 Stronghold Acquisition Founders Acquisition TBD Track Record of Reducing Leverage Since YE’20 Focused on Reducing Leverage Ratio Immediately Accretive Metrics ✓ Production increase1 7% ✓ Reserves2 increase 7% ✓ NTM Adjusted EBITDA increase3 15% ✓ 2H 2023 Adjusted FCF4 increase ~200% ✓ Drilling locations increase ~13% 1. Production increase calculated based on Q4 2023 pro forma mid point estimates 2. Reserves as of 12/31/22 utilizing SEC prices, see footnote 4 on Pg. 4 3. NTM Adj. EBITDA as of 4/1/23 4. See supplemental Non-GAAP financial measures in Appendix 5. Leverage ratio post Stronghold AQ based on annualized third and fourth quarter 2022 and first quarter 2023 EBITDA adjusted for the pro- forma effects of the Stronghold Transaction, as per our credit agreement 6. Estimated Leverage ratio based on REI internal estimates for pro forma company using NYMEX strip pricing as of 7/7/23 – see appendix Legend Leverage Ratio WTI Oil Price
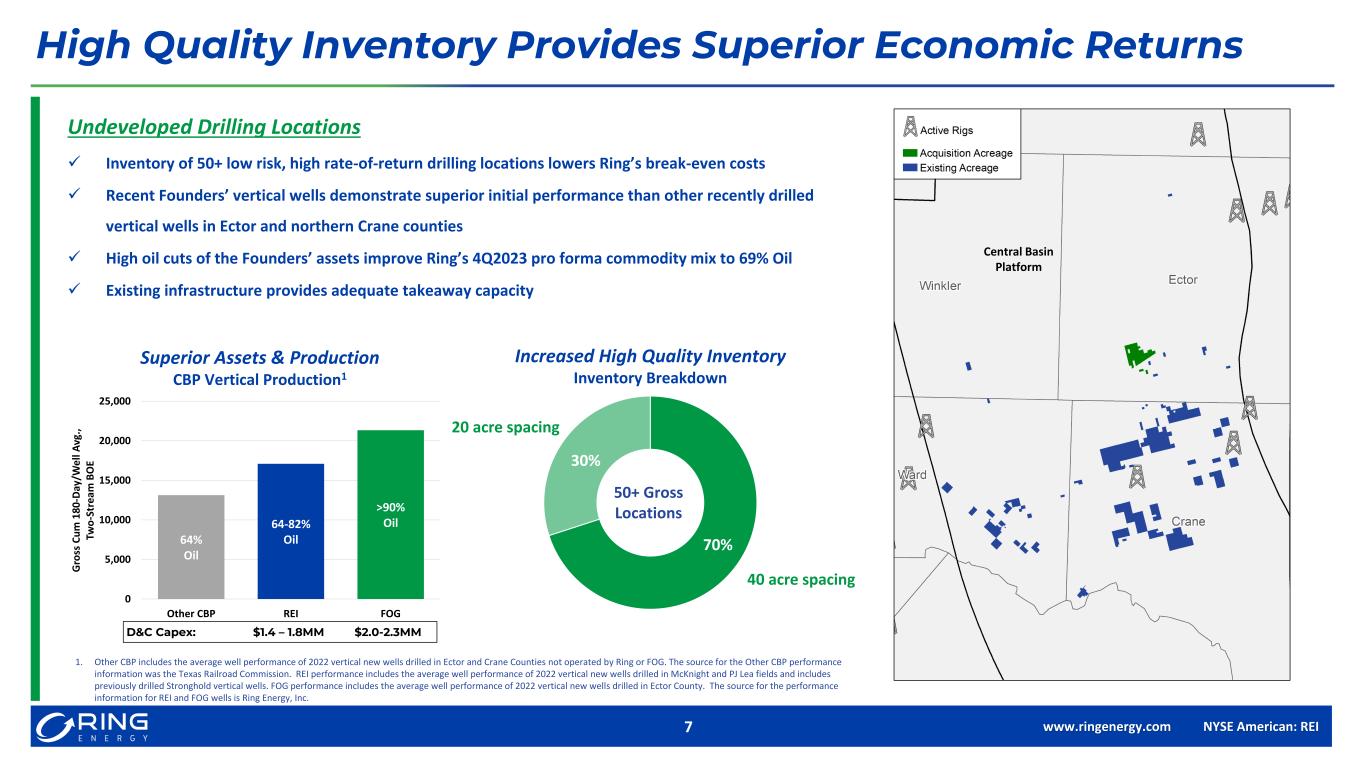
www.ringenergy.com NYSE American: REI Central Basin Platform 40 acre spacing 20 acre spacing 50+ Gross Locations 7 High Quality Inventory Provides Superior Economic Returns 1. Other CBP includes the average well performance of 2022 vertical new wells drilled in Ector and Crane Counties not operated by Ring or FOG. The source for the Other CBP performance information was the Texas Railroad Commission. REI performance includes the average well performance of 2022 vertical new wells drilled in McKnight and PJ Lea fields and includes previously drilled Stronghold vertical wells. FOG performance includes the average well performance of 2022 vertical new wells drilled in Ector County. The source for the performance information for REI and FOG wells is Ring Energy, Inc. CBP Vertical Production1 Superior Assets & Production Inventory Breakdown Increased High Quality Inventory D&C Capex: $1.4 – 1.8MM $2.0-2.3MM Undeveloped Drilling Locations ✓ Inventory of 50+ low risk, high rate-of-return drilling locations lowers Ring’s break-even costs ✓ Recent Founders’ vertical wells demonstrate superior initial performance than other recently drilled vertical wells in Ector and northern Crane counties ✓ High oil cuts of the Founders’ assets improve Ring’s 4Q2023 pro forma commodity mix to 69% Oil ✓ Existing infrastructure provides adequate takeaway capacity 64% Oil 64-82% Oil >90% Oil 0 5,000 10,000 15,000 20,000 25,000 Other CBP REI FOG G ro ss C u m 1 8 0 -D ay /W e ll A vg ., Tw o -S tr e am B O E 30% 70%
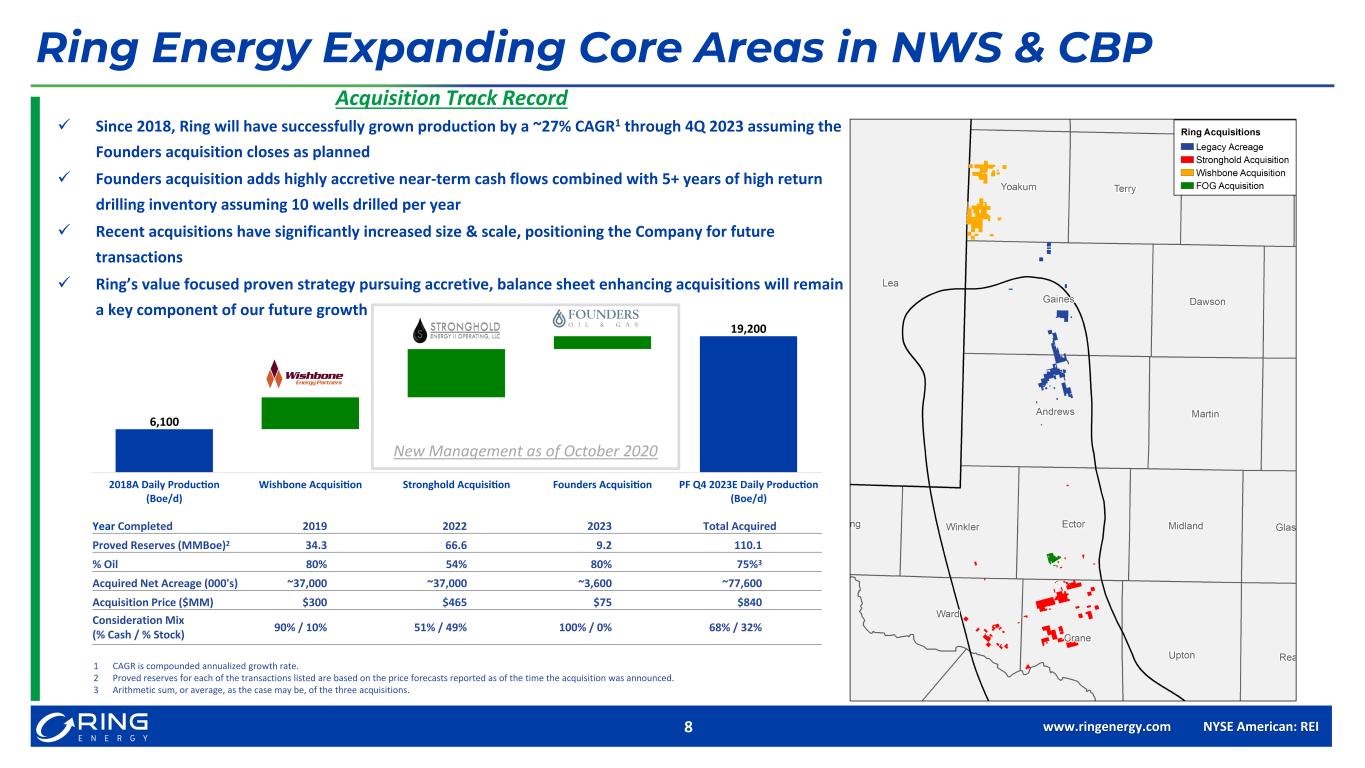
www.ringenergy.com NYSE American: REI8 Ring Energy Expanding Core Areas in NWS & CBP Acquisition Track Record ✓ Since 2018, Ring will have successfully grown production by a ~27% CAGR1 through 4Q 2023 assuming the Founders acquisition closes as planned ✓ Founders acquisition adds highly accretive near-term cash flows combined with 5+ years of high return drilling inventory assuming 10 wells drilled per year ✓ Recent acquisitions have significantly increased size & scale, positioning the Company for future transactions ✓ Ring’s value focused proven strategy pursuing accretive, balance sheet enhancing acquisitions will remain a key component of our future growth New Management as of October 2020 1 CAGR is compounded annualized growth rate. 2 Proved reserves for each of the transactions listed are based on the price forecasts reported as of the time the acquisition was announced. 3 Arithmetic sum, or average, as the case may be, of the three acquisitions. Year Completed 2019 2022 2023 Total Acquired Proved Reserves (MMBoe)2 34.3 66.6 9.2 110.1 % Oil 80% 54% 80% 75%3 Acquired Net Acreage (000's) ~37,000 ~37,000 ~3,600 ~77,600 Acquisition Price ($MM) $300 $465 $75 $840 Consideration Mix (% Cash / % Stock) 90% / 10% 51% / 49% 100% / 0% 68% / 32%
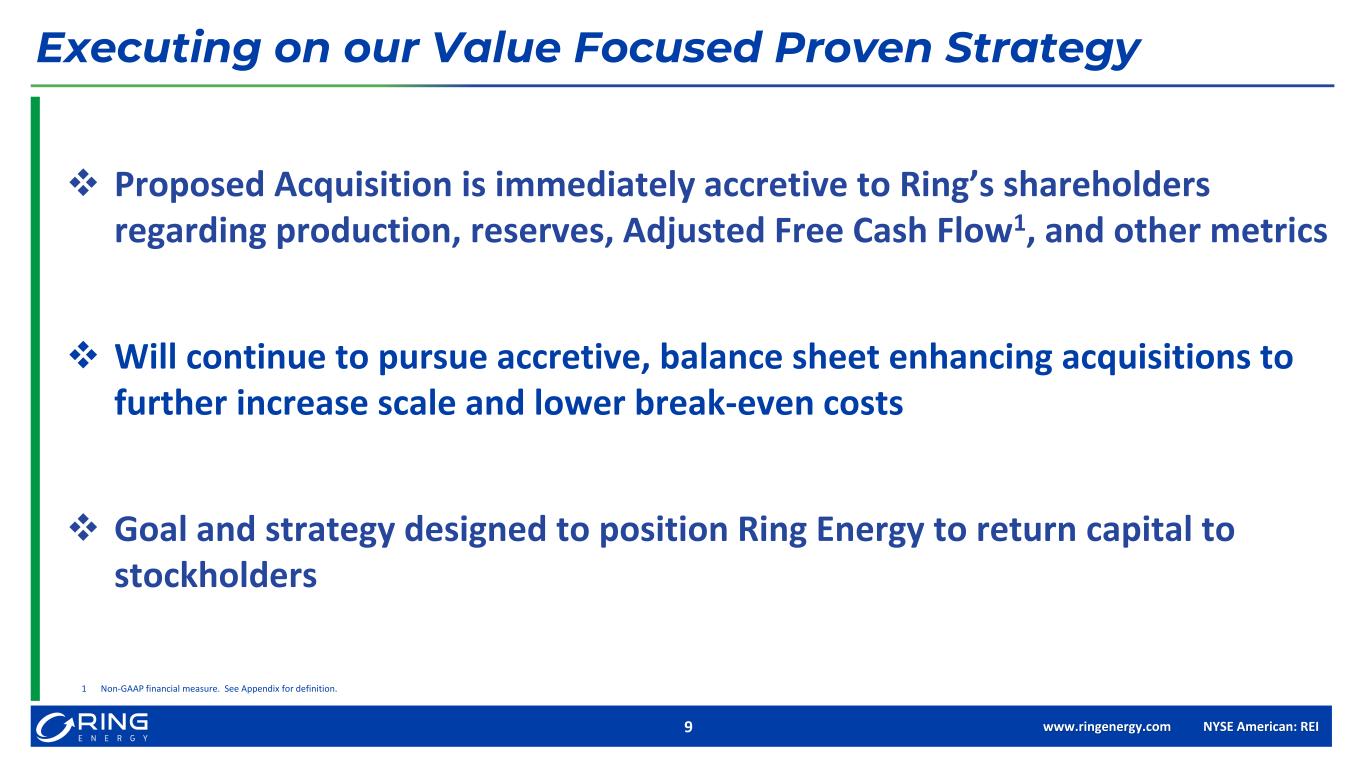
www.ringenergy.com NYSE American: REI9 Executing on our Value Focused Proven Strategy ❖ Proposed Acquisition is immediately accretive to Ring’s shareholders regarding production, reserves, Adjusted Free Cash Flow1, and other metrics ❖ Will continue to pursue accretive, balance sheet enhancing acquisitions to further increase scale and lower break-even costs ❖ Goal and strategy designed to position Ring Energy to return capital to stockholders 1 Non-GAAP financial measure. See Appendix for definition.
ANALYST COVERAGE COMPANY CONTACT Al Petrie (281) 975-2146 apetrie@ringenergy.com Chris Delange (281) 975-2146 cdelange@ringenergy.com Alliance Global Partners (A.G.P.) Jeff Grampp (949) 296-4171 jgrampp@allianceg.com ROTH Capital Partners John M. White (949) 720-7115 jwhite@roth.com Truist Financial Neal Dingmann (713) 247-9000 neal.dingmann@truist.com Tuohy Brothers Investment Noel Parks (215) 913-7320 nparks@tuohybrothers.com Water Tower Research Jeff Robertson (469) 343-9962 jeff@watertowerresearch.com 10
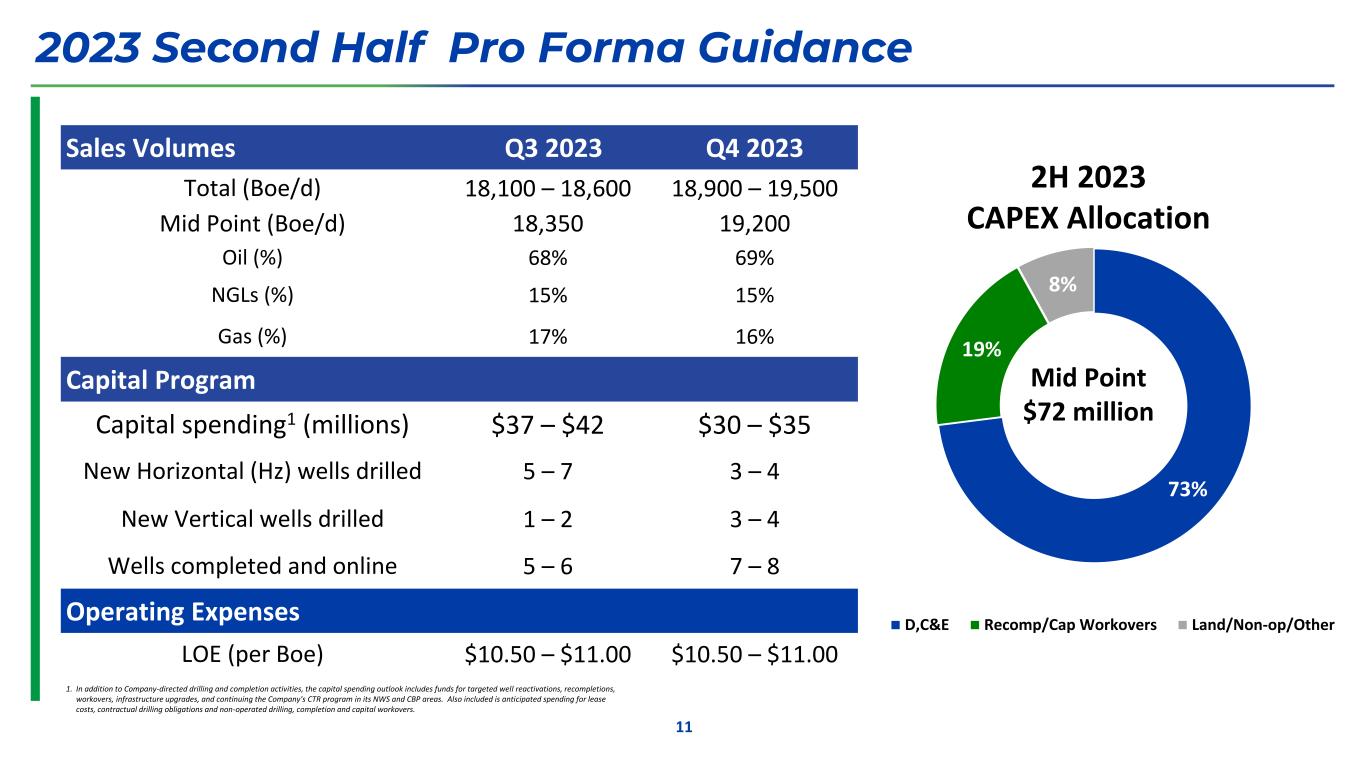
2023 Second Half Pro Forma Guidance Sales Volumes Q3 2023 Q4 2023 Total (Boe/d) 18,100 – 18,600 18,900 – 19,500 Mid Point (Boe/d) 18,350 19,200 Oil (%) 68% 69% NGLs (%) 15% 15% Gas (%) 17% 16% Capital Program Capital spending1 (millions) $37 – $42 $30 – $35 New Horizontal (Hz) wells drilled 5 – 7 3 – 4 New Vertical wells drilled 1 – 2 3 – 4 Wells completed and online 5 – 6 7 – 8 Operating Expenses LOE (per Boe) $10.50 – $11.00 $10.50 – $11.00 73% 19% 8% D,C&E Recomp/Cap Workovers Land/Non-op/Other 2H 2023 CAPEX Allocation Mid Point $72 million 1. In addition to Company-directed drilling and completion activities, the capital spending outlook includes funds for targeted well reactivations, recompletions, workovers, infrastructure upgrades, and continuing the Company's CTR program in its NWS and CBP areas. Also included is anticipated spending for lease costs, contractual drilling obligations and non-operated drilling, completion and capital workovers. 11
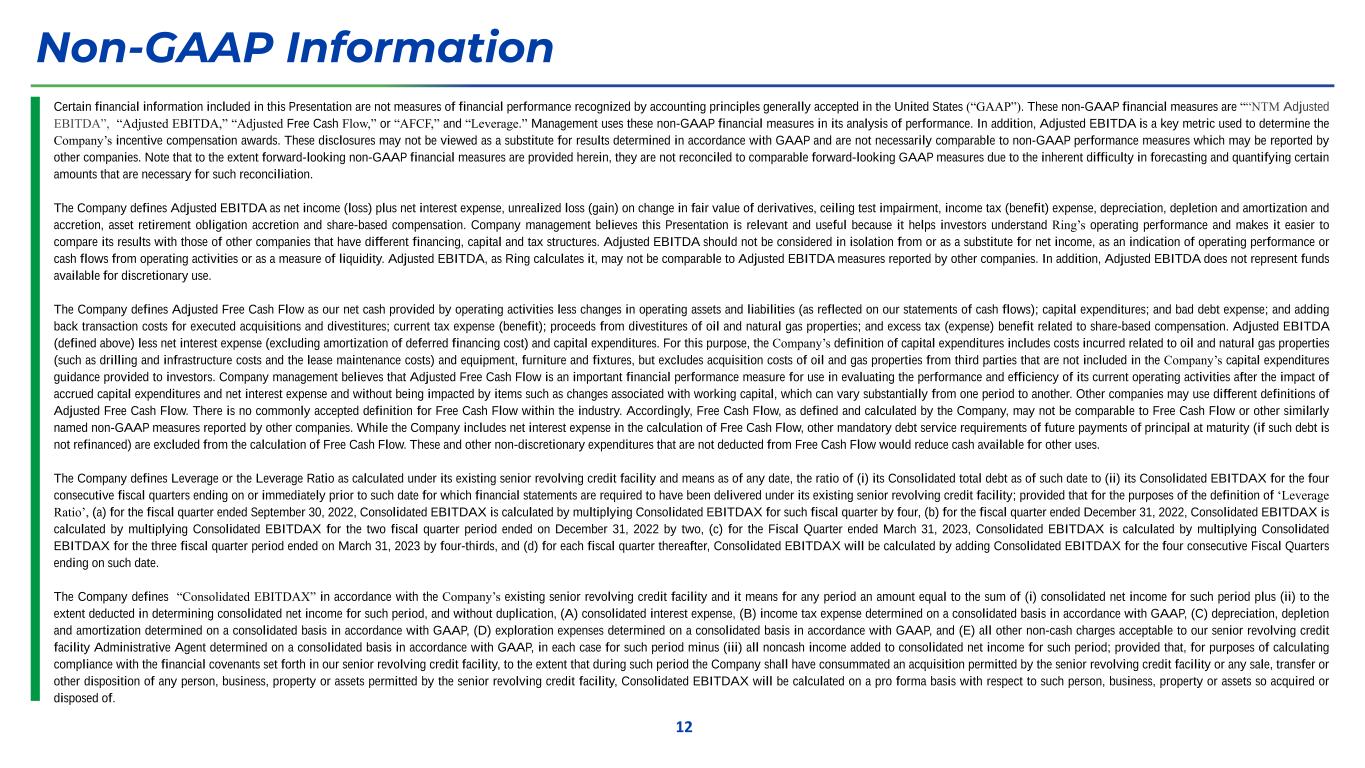
Non-GAAP Information 12 Certain financial information included in this Presentation are not measures of financial performance recognized by accounting principles generally accepted in the United States (“GAAP”). These non-GAAP financial measures are ““NTM Adjusted EBITDA”, “Adjusted EBITDA,” “Adjusted Free Cash Flow,” or “AFCF,” and “Leverage.” Management uses these non-GAAP financial measures in its analysis of performance. In addition, Adjusted EBITDA is a key metric used to determine the Company’s incentive compensation awards. These disclosures may not be viewed as a substitute for results determined in accordance with GAAP and are not necessarily comparable to non-GAAP performance measures which may be reported by other companies. Note that to the extent forward-looking non-GAAP financial measures are provided herein, they are not reconciled to comparable forward-looking GAAP measures due to the inherent difficulty in forecasting and quantifying certain amounts that are necessary for such reconciliation. The Company defines Adjusted EBITDA as net income (loss) plus net interest expense, unrealized loss (gain) on change in fair value of derivatives, ceiling test impairment, income tax (benefit) expense, depreciation, depletion and amortization and accretion, asset retirement obligation accretion and share-based compensation. Company management believes this Presentation is relevant and useful because it helps investors understand Ring’s operating performance and makes it easier to compare its results with those of other companies that have different financing, capital and tax structures. Adjusted EBITDA should not be considered in isolation from or as a substitute for net income, as an indication of operating performance or cash flows from operating activities or as a measure of liquidity. Adjusted EBITDA, as Ring calculates it, may not be comparable to Adjusted EBITDA measures reported by other companies. In addition, Adjusted EBITDA does not represent funds available for discretionary use. The Company defines Adjusted Free Cash Flow as our net cash provided by operating activities less changes in operating assets and liabilities (as reflected on our statements of cash flows); capital expenditures; and bad debt expense; and adding back transaction costs for executed acquisitions and divestitures; current tax expense (benefit); proceeds from divestitures of oil and natural gas properties; and excess tax (expense) benefit related to share-based compensation. Adjusted EBITDA (defined above) less net interest expense (excluding amortization of deferred financing cost) and capital expenditures. For this purpose, the Company’s definition of capital expenditures includes costs incurred related to oil and natural gas properties (such as drilling and infrastructure costs and the lease maintenance costs) and equipment, furniture and fixtures, but excludes acquisition costs of oil and gas properties from third parties that are not included in the Company’s capital expenditures guidance provided to investors. Company management believes that Adjusted Free Cash Flow is an important financial performance measure for use in evaluating the performance and efficiency of its current operating activities after the impact of accrued capital expenditures and net interest expense and without being impacted by items such as changes associated with working capital, which can vary substantially from one period to another. Other companies may use different definitions of Adjusted Free Cash Flow. There is no commonly accepted definition for Free Cash Flow within the industry. Accordingly, Free Cash Flow, as defined and calculated by the Company, may not be comparable to Free Cash Flow or other similarly named non-GAAP measures reported by other companies. While the Company includes net interest expense in the calculation of Free Cash Flow, other mandatory debt service requirements of future payments of principal at maturity (if such debt is not refinanced) are excluded from the calculation of Free Cash Flow. These and other non-discretionary expenditures that are not deducted from Free Cash Flow would reduce cash available for other uses. The Company defines Leverage or the Leverage Ratio as calculated under its existing senior revolving credit facility and means as of any date, the ratio of (i) its Consolidated total debt as of such date to (ii) its Consolidated EBITDAX for the four consecutive fiscal quarters ending on or immediately prior to such date for which financial statements are required to have been delivered under its existing senior revolving credit facility; provided that for the purposes of the definition of ‘Leverage Ratio’, (a) for the fiscal quarter ended September 30, 2022, Consolidated EBITDAX is calculated by multiplying Consolidated EBITDAX for such fiscal quarter by four, (b) for the fiscal quarter ended December 31, 2022, Consolidated EBITDAX is calculated by multiplying Consolidated EBITDAX for the two fiscal quarter period ended on December 31, 2022 by two, (c) for the Fiscal Quarter ended March 31, 2023, Consolidated EBITDAX is calculated by multiplying Consolidated EBITDAX for the three fiscal quarter period ended on March 31, 2023 by four-thirds, and (d) for each fiscal quarter thereafter, Consolidated EBITDAX will be calculated by adding Consolidated EBITDAX for the four consecutive Fiscal Quarters ending on such date. The Company defines “Consolidated EBITDAX” in accordance with the Company’s existing senior revolving credit facility and it means for any period an amount equal to the sum of (i) consolidated net income for such period plus (ii) to the extent deducted in determining consolidated net income for such period, and without duplication, (A) consolidated interest expense, (B) income tax expense determined on a consolidated basis in accordance with GAAP, (C) depreciation, depletion and amortization determined on a consolidated basis in accordance with GAAP, (D) exploration expenses determined on a consolidated basis in accordance with GAAP, and (E) all other non-cash charges acceptable to our senior revolving credit facility Administrative Agent determined on a consolidated basis in accordance with GAAP, in each case for such period minus (iii) all noncash income added to consolidated net income for such period; provided that, for purposes of calculating compliance with the financial covenants set forth in our senior revolving credit facility, to the extent that during such period the Company shall have consummated an acquisition permitted by the senior revolving credit facility or any sale, transfer or other disposition of any person, business, property or assets permitted by the senior revolving credit facility, Consolidated EBITDAX will be calculated on a pro forma basis with respect to such person, business, property or assets so acquired or disposed of.
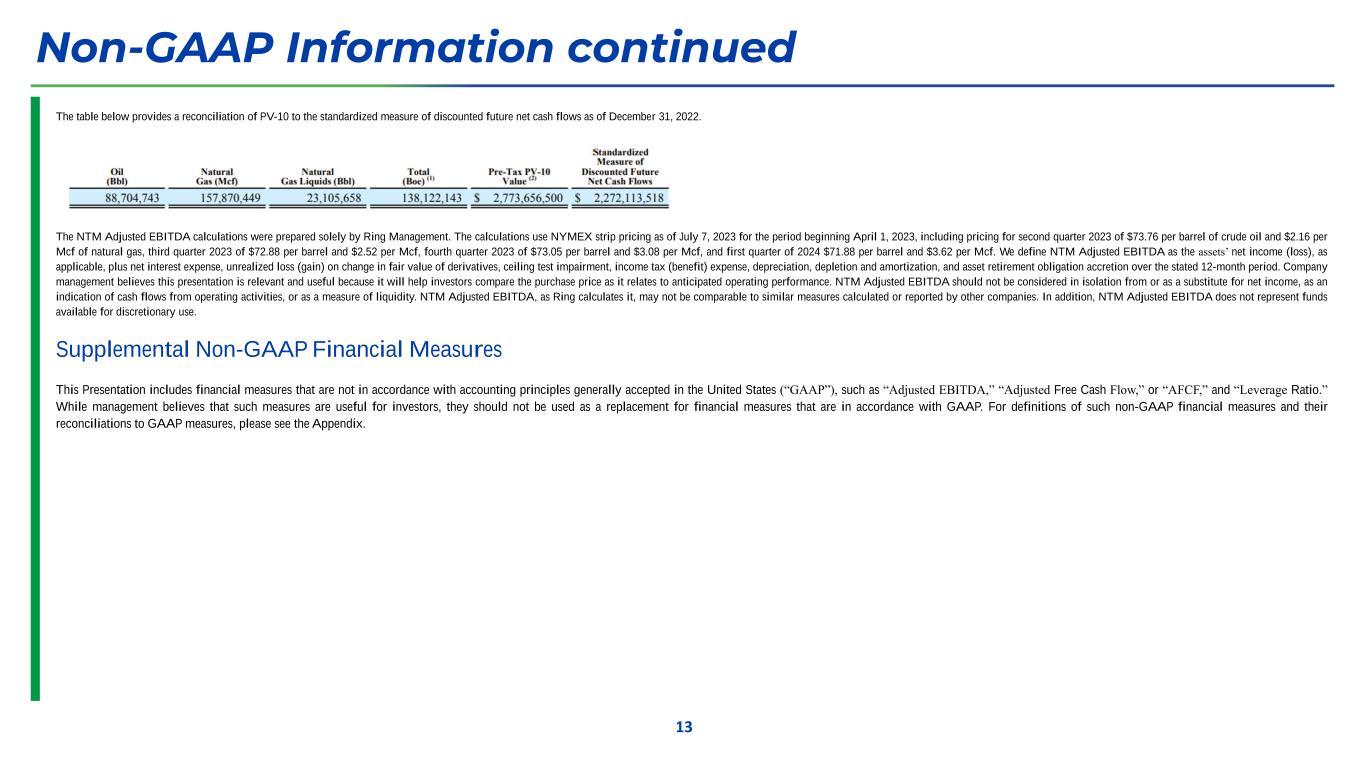
Non-GAAP Information continued The table below provides a reconciliation of PV-10 to the standardized measure of discounted future net cash flows as of December 31, 2022. The NTM Adjusted EBITDA calculations were prepared solely by Ring Management. The calculations use NYMEX strip pricing as of July 7, 2023 for the period beginning April 1, 2023, including pricing for second quarter 2023 of $73.76 per barrel of crude oil and $2.16 per Mcf of natural gas, third quarter 2023 of $72.88 per barrel and $2.52 per Mcf, fourth quarter 2023 of $73.05 per barrel and $3.08 per Mcf, and first quarter of 2024 $71.88 per barrel and $3.62 per Mcf. We define NTM Adjusted EBITDA as the assets’ net income (loss), as applicable, plus net interest expense, unrealized loss (gain) on change in fair value of derivatives, ceiling test impairment, income tax (benefit) expense, depreciation, depletion and amortization, and asset retirement obligation accretion over the stated 12-month period. Company management believes this presentation is relevant and useful because it will help investors compare the purchase price as it relates to anticipated operating performance. NTM Adjusted EBITDA should not be considered in isolation from or as a substitute for net income, as an indication of cash flows from operating activities, or as a measure of liquidity. NTM Adjusted EBITDA, as Ring calculates it, may not be comparable to similar measures calculated or reported by other companies. In addition, NTM Adjusted EBITDA does not represent funds available for discretionary use. Supplemental Non-GAAP Financial Measures This Presentation includes financial measures that are not in accordance with accounting principles generally accepted in the United States (“GAAP”), such as “Adjusted EBITDA,” “Adjusted Free Cash Flow,” or “AFCF,” and “Leverage Ratio.” While management believes that such measures are useful for investors, they should not be used as a replacement for financial measures that are in accordance with GAAP. For definitions of such non-GAAP financial measures and their reconciliations to GAAP measures, please see the Appendix. 13