Exhibit 99.2
www. ringenergy.com NYSE American: REI RING ENERGY ACQUIRES STRONGHOLD ENERGY II TRANSACTION SUMMARY July 5, 202 2 INCREASING SHAREHOLDER VALUE ENHANCING SIZE AND SCALE LOWERING BREAK - EVEN COSTS
www.ringenergy.com NYSE American: REI 2 Forward - Looking Statements and Cautionary Notes 2 Forward – Looking Statements This Presentation includes "forward - looking statements" within the meaning of the Private Securities Litigation Reform Act of 19 95, Section 27A of the Securities Act of 1933, as amended, and Section 21E of the Securities Exchange Act of 1934, as amended . A ll statements, other than statements of strictly historical facts included in this Presentation constitute forward - looking statements and may often, but n ot always, be identified by the use of such words as “may,” “will,” “should,” “could,” “intends,” “estimates,” “expects,” “an tic ipates,” “plans,” “project,” “guidance,” “target,” “potential,” “possible,” “probably,” and “believes” or the negative variations thereof or comparable te rmi nology. The forward - looking statements include statements about the expected benefits of the acquisition of certain assets (the “Stronghold Acquisition”) from Stronghold Energy II Operating LLC and Stronghold Royalties, LP (collectively “Stronghold”) by Ring, the expected future re serves, production, financial position, business strategy, revenues, earnings, free cash flow, cost, capital expenditures and de bt levels of Ring, and plans and objectives of Ring management for future operations. Forward - looking statements are subject to numerous assumptions, risks and uncertainties that may cause actual results to be materially different than any future results expressed or implied in those sta tements. However, whether actual results and developments will conform to expectations is subject to a number of material risks and uncertainties, incl udi ng but not limited to: declines in oil, natural gas liquids or natural gas prices; the level of success in exploration, devel opm ent and production activities; the timing of exploration and development expenditures; inaccuracies of reserve estimates or assumptions underlying them; revisio ns to reserve estimates as a result of changes in commodity prices or production history; impacts to financial statements as a r esu lt of impairment write - downs; risks related to level of indebtedness and periodic redeterminations of the borrowing base under the Company’s credit fac ility; the impacts of hedging on results of operations; the Company’s ability to replace oil and natural gas reserves; any lo ss of senior management or technical personnel; and the direct and indirect impact on most or all of the foregoing due to the COVID - 19 pandemic. Some of th e factors that could cause actual results to differ materially from expected results are described under “Risk Factors” in ou r 2 021 annual report on Form 10 - K filed with the U.S. Securities and Exchange Commission (“SEC”) on March 16, 2022, and in our subsequent quarterly reports on For m 10 - Q and current reports on Form 8 - K. Although the Company believes that the assumptions upon which such forward - looking state ments are based are reasonable, it can give no assurance that such assumptions will prove to be correct. All forward - looking statements in this Pres entation are expressly qualified by the cautionary statements and by reference to the underlying assumptions that may prove t o b e incorrect. Material risks with respect to the Stronghold Acquisition include the risk that the acquisition may not close due to unforeseen circumstanc es and issues that may be discovered in the review of the assets proposed to be acquired, the inability of the Ring’s lending ba nks or Ring to complete the expected amendment to Ring’s revolving credit facility that is proposed to provide for a $600 million borrowing base, failure to achieve the expected benefits of the acquisition to Ring and its stockholders, failure to complete the acquisition on a tim et able in line with Ring management’s expectations, and uncertainties regarding the expected future reserves, production, financial position, business st rategy, revenues, earnings and cost levels of the combined company. Additional risks include completion of the acquisition on an ticipated terms and timetable, the ability to integrate the operations of the combined entity successfully after the acquisition and achieve its an ticipated benefits, the possibility that various closing conditions for the acquisition may not be satisfied or waived, risks re lated to any unforeseen liabilities of Ring or the assets proposed to be acquired, and risks related to the amounts of debt levels in periodic redeterminations of the bo rro wing base under Ring’s credit agreement and risks involved in amending the credit agreement. The Company undertakes no obligation to publicly revise these forward - looking statements to reflect events or circumstances that arise after the date hereof, except as required by applicable law. The financial and operating estimates contained in this pr es entation represent our reasonable estimates as of the date of this Presentation. Neither our independent auditors nor any other third party has exam ine d, reviewed or compiled the projections and, accordingly, none of the foregoing expresses an opinion or other form of assuran ce with respect thereto. The assumptions upon which the projections are based are described in more detail herein. Some of these assumptions inevitably wi ll not materialize, and unanticipated events may occur that could affect our results. Therefore, our actual results achieved dur ing the periods covered by the estimates will vary from the projected results. Prospective investors are cautioned not to place undue reliance on the estima tes included herein. Cautionary Note regarding Hydrocarbon Disclosures The SEC has generally permitted oil and natural gas companies, in their filings with the SEC, to disclose proved reserves, wh ich are reserve estimates that geological and engineering data demonstrate with reasonable certainty to be recoverable in future ye ars from known reservoirs under existing economic and operating conditions, and certain probable and possible reserves that meet the SEC’s definitions for such terms. We use the terms “estimated ultimate recovery,” or “EURs,” “probable,” “possible,” and “non - proven” reserves, reser ve “potential” or “upside” or other descriptions of volumes of reserves potentially recoverable through additional drilling or recovery techniques that the SEC’s guidelines prohibit us from including in filings with the SEC. Reference to EURs of natural gas and oil includes amount s that are not yet classified as proved reserves under SEC definitions, but that we believe should ultimately be produced and are based on previous operating exp erience in a given area and publicly available information relating to the operations of producers who are conducting operati ons in these areas. These estimates are by their nature more speculative than estimates of proved reserves and accordingly are subject to substantially gr eater risk of being actually realized by us. Factors affecting the ultimate recovery of reserves that may be recovered includ e t he scope of our drilling programs, which will be directly affected by capital availability, drilling and production costs, commodity prices, availability of ser vic es and equipment, permit expirations, transportation constraints, regulatory approvals and other factors, and actual drilling re sults, including geological and mechanical factors affecting recovery rates. Accordingly, actual quantities that may be recovered from our interests will dif fer from our estimates and could be significantly less than our targeted recovery rate. In addition, our estimates may change sig ni ficantly as we receive additional data. Supplemental Non - GAAP Financial Measures This Presentation includes financial measures that are not in accordance with accounting principles generally accepted in the Un ited States (“GAAP”), such as “Adjusted Net Income,” “Adjusted EBITDA,” “PV - 10,” “Free Cash Flow,” or “FCF,” and “Cash Flow from Operations.” While management believes that such measures are useful for investors, they should not be used as a replacement for financial measu res that are in accordance with GAAP. For definitions of such non - GAAP financial measures and their reconciliations to GAAP measure s, please see the Appendix.
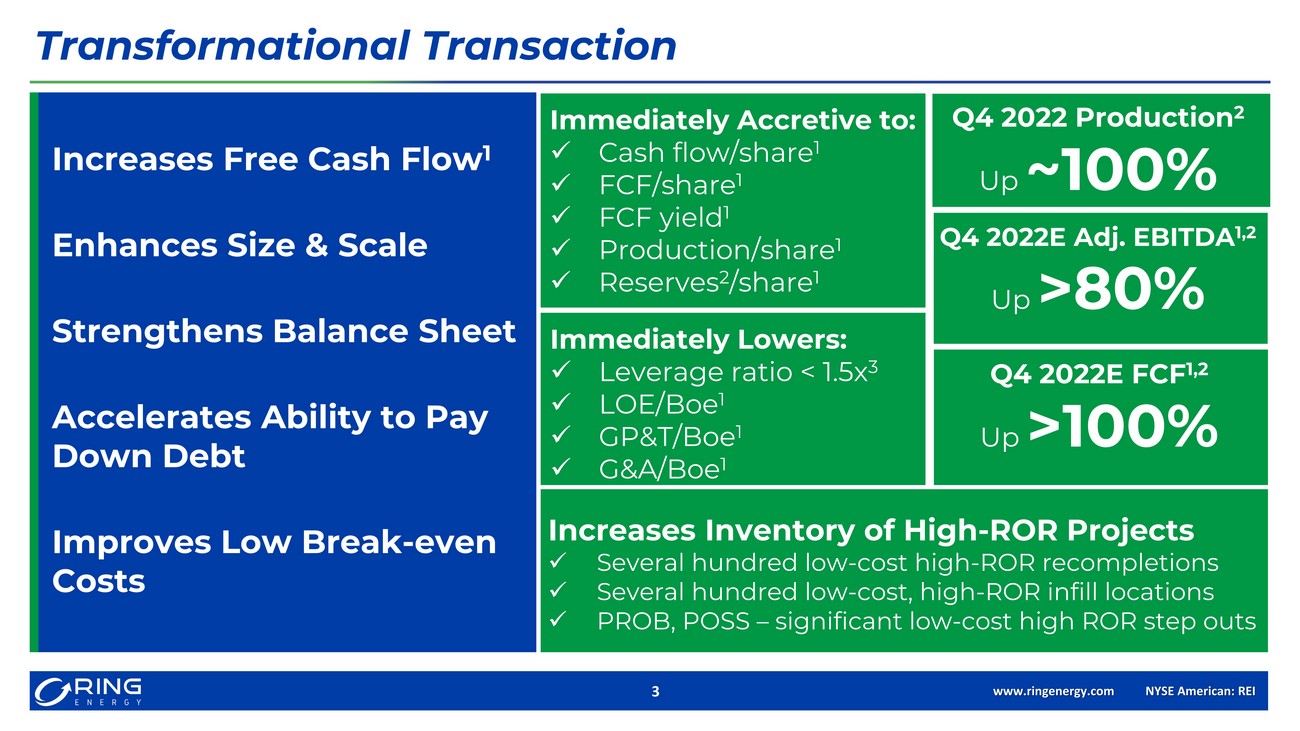
www.ringenergy.com NYSE American: REI 3 Increases Free Cash Flow 1 Enhances Size & Scale Strengthens Balance Sheet Accelerates Ability to Pay Down Debt Improves Low Break - even Costs Transformational Transaction Immediately Accretive to: x Cash flow/share 1 x FCF/share 1 x FCF yield 1 x Production/share 1 x Reserves 2 /share 1 Immediately Lowers: x Leverage ratio < 1.5x 3 x LOE/Boe 1 x GP&T/Boe 1 x G&A/Boe 1 Increases Inventory of High - ROR Projects x Several hundred low - cost high - ROR recompletions x Several hundred low - cost, high - ROR infill locations x PROB, POSS – significant low - cost high ROR step outs Q4 2022 Production 2 Up ~100% Q4 2022E Adj. EBITDA 1,2 Up >80% Q4 2022E FCF 1,2 Up >100%
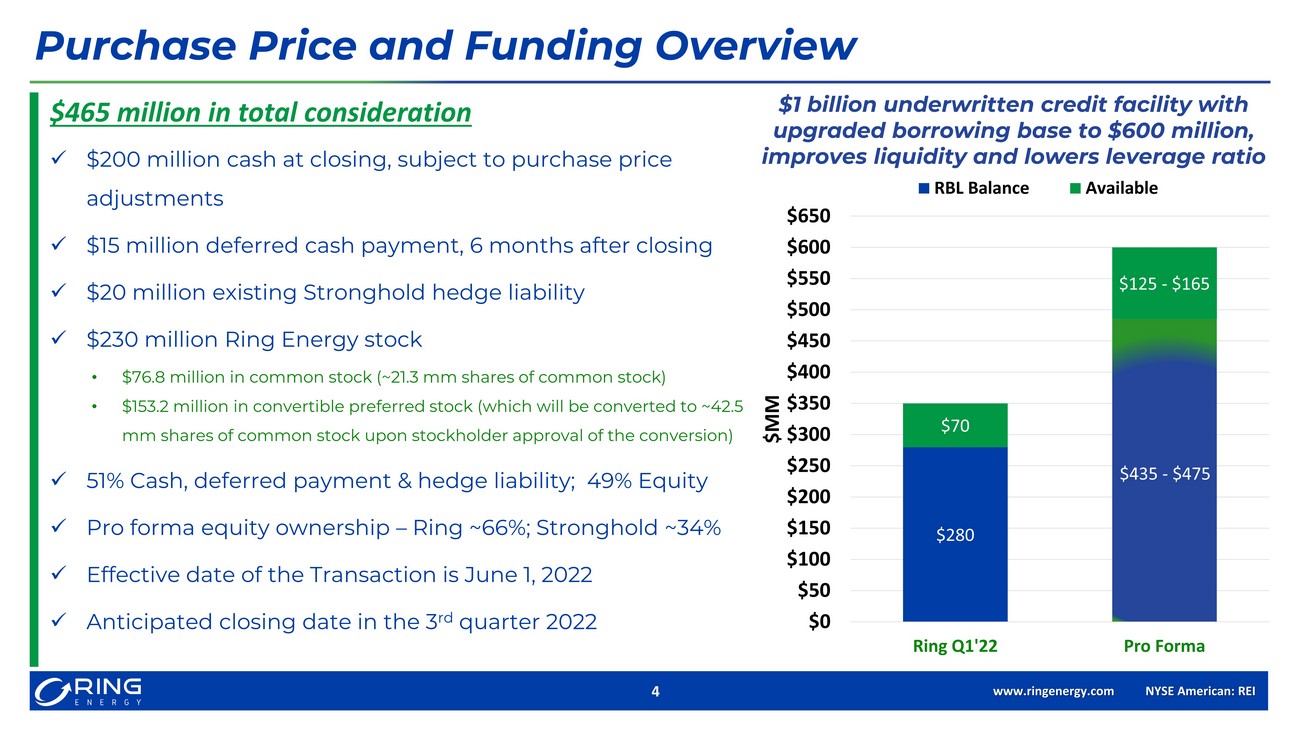
www.ringenergy.com NYSE American: REI 4 Purchase Price and Funding Overview $1 billion underwritten credit facility with upgraded borrowing base to $600 million, improves liquidity and lowers leverage ratio $280 $435 - $475 $70 $125 - $165 $0 $50 $100 $150 $200 $250 $300 $350 $400 $450 $500 $550 $600 $650 Ring Q1'22 Pro Forma $MM RBL Balance Available $465 million in total consideration x $200 million cash at closing, subject to purchase price adjustments x $15 million deferred cash payment, 6 months after closing x $20 million existing Stronghold hedge liability x $230 million Ring Energy stock x 51% Cash, deferred payment & hedge liability; 49% Equity x Pro forma equity ownership – Ring ~66%; Stronghold ~34% x Effective date of the Transaction is June 1, 2022 x Anticipated closing date in the 3 rd quarter 2022 • $76.8 million in common stock (~21.3 mm shares of common stock) • $153.2 million in convertible preferred stock (which will be converted to ~42.5 mm shares of common stock upon stockholder approval of the conversion)
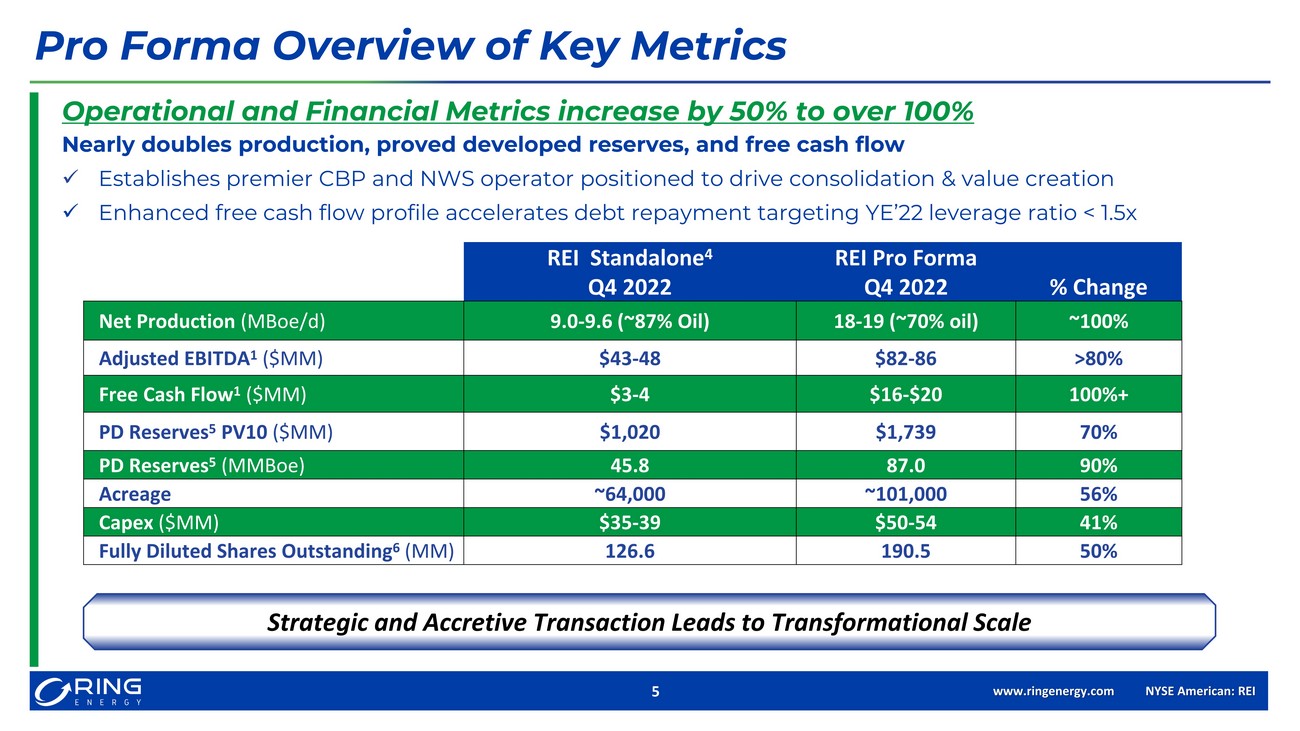
www.ringenergy.com NYSE American: REI 5 Operational and Financial Metrics increase by 50% to over 100% Nearly doubles production, proved developed reserves, and free cash flow x Establishes premier CBP and NWS operator positioned to drive consolidation & value creation x Enhanced free cash flow profile accelerates debt repayment targeting YE’22 leverage ratio < 1.5x Pro Forma Overview of Key Metrics Strategic and Accretive Transaction Leads to Transformational Scale REI Standalone 4 Q4 2022 REI Pro Forma Q4 2022 % Change Net Production ( MBoe /d) 9.0 - 9.6 (~87% Oil) 18 - 19 (~70% oil) ~100% Adjusted EBITDA 1 ($MM) $43 - 48 $82 - 86 >80% Free Cash Flow 1 ($MM) $3 - 4 $16 - $20 100%+ PD Reserves 5 PV10 ($MM) $1,020 $1,739 70% PD Reserves 5 ( MMBoe ) 45.8 87.0 90% Acreage ~64,000 ~101,000 56% Capex ($MM) $35 - 39 $50 - 54 41% Fully Diluted Shares Outstanding 6 (MM) 126.6 190.5 50%
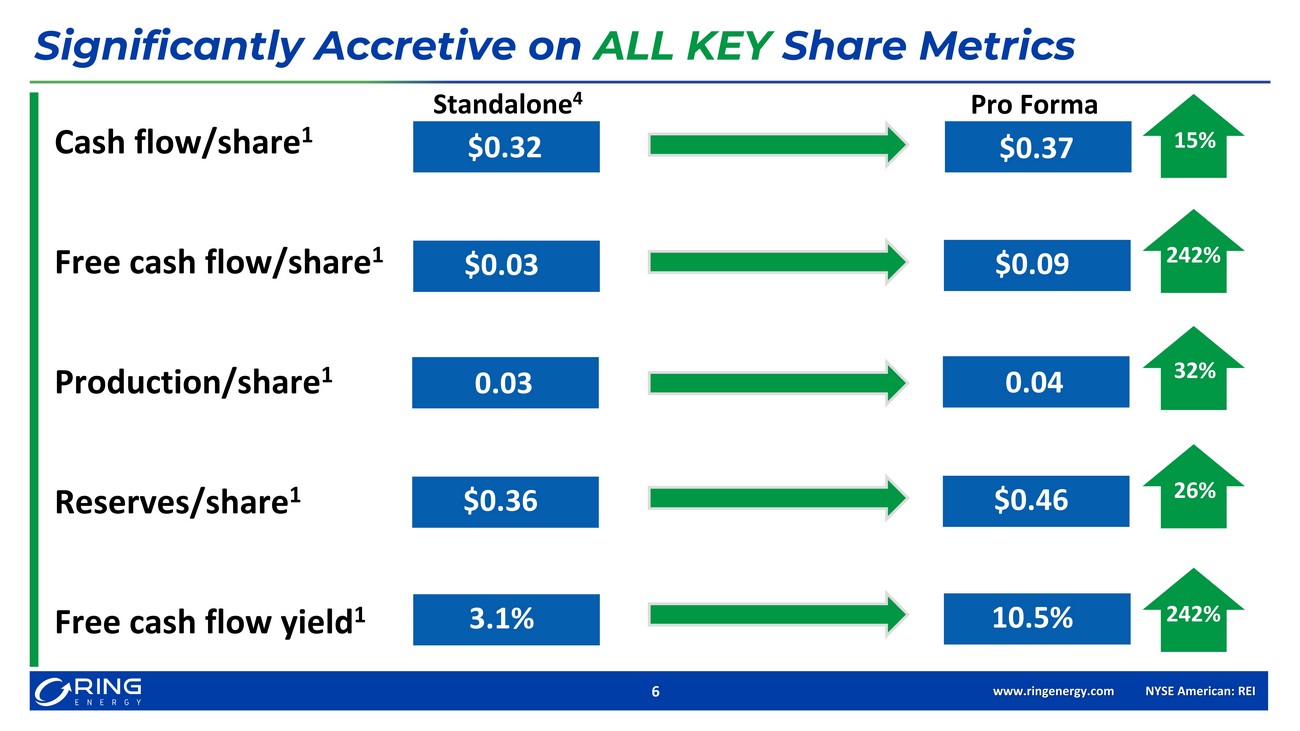
www.ringenergy.com NYSE American: REI 6 Significantly Accretive on ALL KEY Share Metrics Cash flow/share 1 197% $0.32 Standalone 4 Pro Forma 15% Free cash flow/share 1 $0.37 Free cash flow yield 1 Production/share 1 Reserves/share 1 $0.03 0.03 $0.36 3.1% 197% $0.09 0.04 $0.46 10.5% 242% 32% 26% 242%
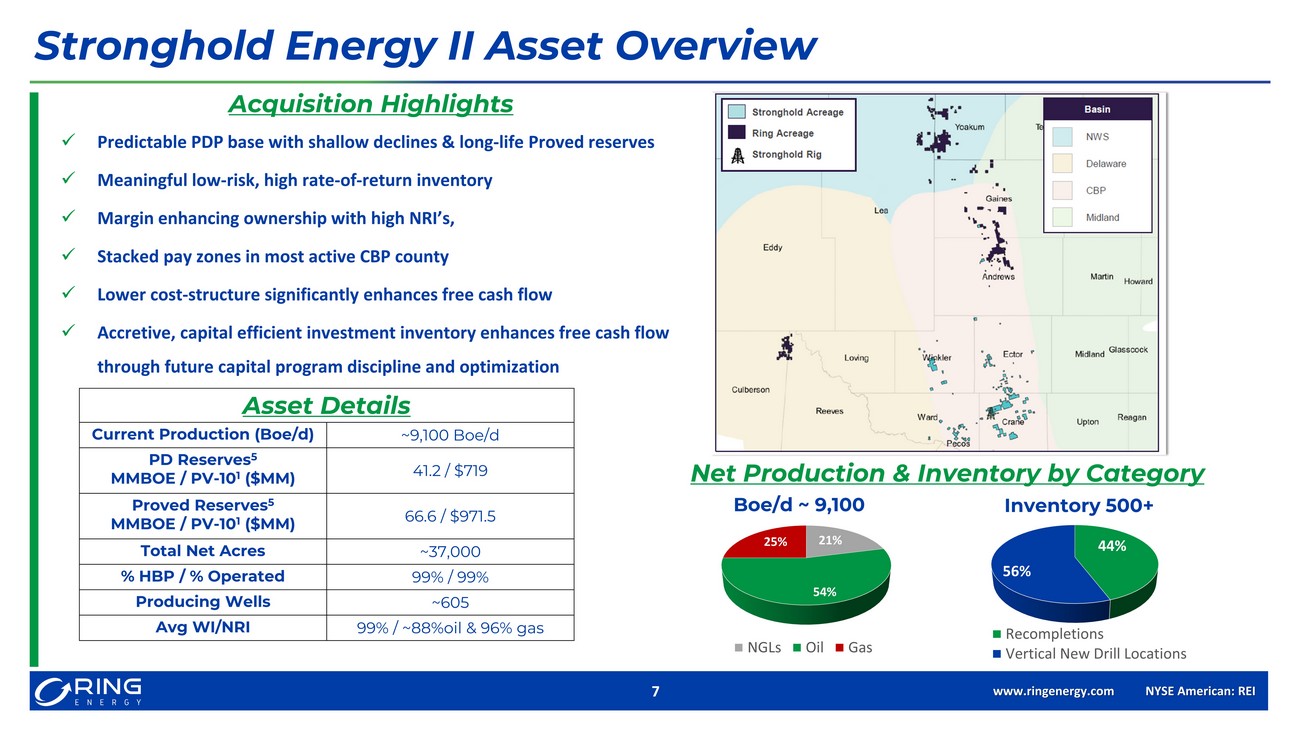
www.ringenergy.com NYSE American: REI 7 Stronghold Energy II Asset Overview Acquisition Highlights x Predictable PDP base with shallow declines & long - life Proved reserves x Meaningful low - risk, high rate - of - return inventory x Margin enhancing ownership with high NRI’s, x Stacked pay zones in most active CBP county x Lower cost - structure significantly enhances free cash flow x Accretive, capital efficient investment inventory enhances free cash flow through future capital program discipline and optimization Asset Details Current Production ( Boe /d) ~9,100 Boe /d PD Reserves 5 MMBOE / PV - 10 1 ($MM) 41.2 / $719 Proved Reserves 5 MMBOE / PV - 10 1 ($MM) 66.6 / $971.5 Total Net Acres ~37,000 % HBP / % Operated 99% / 99% Producing Wells ~605 Avg WI/NRI 99% / ~88%oil & 96% gas 44% 56% Recompletions Vertical New Drill Locations Inventory 500+ Net Production & Inventory by Category Boe /d ~ 9,100 21% 54% 25% NGLs Oil Gas
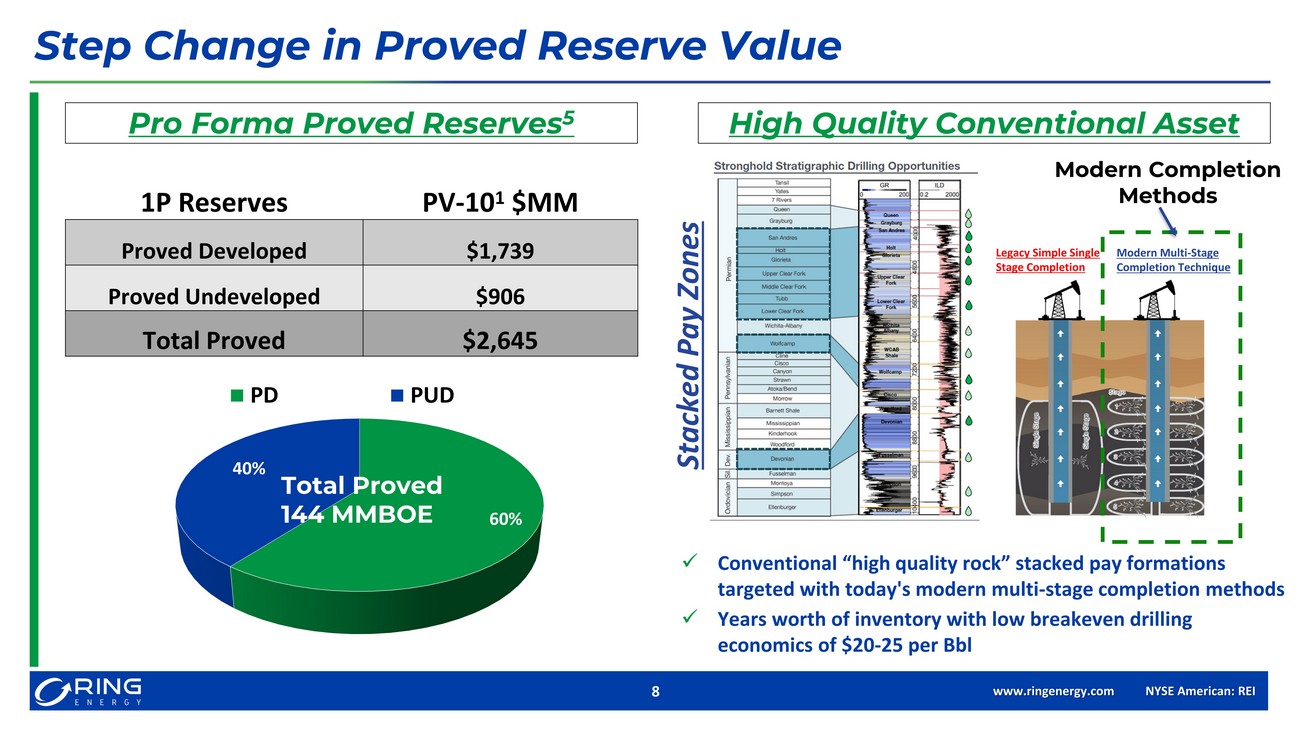
www.ringenergy.com NYSE American: REI 8 Step Change in Proved Reserve Value Pro Forma Proved Reserves 5 1P Reserves PV - 10 1 $MM Proved Developed $1,739 Proved Undeveloped $906 Total Proved $2,645 60% 40% PD PUD Total Proved 144 MMBOE Stacked Pay Zones High Quality Conventional Asset Legacy Simple Single Stage Completion Modern Multi - Stage Completion Technique Modern Completion Methods x Conventional “high quality rock” stacked pay formations targeted with today's modern multi - stage completion methods x Years worth of inventory with low breakeven drilling economics of $20 - 25 per Bbl
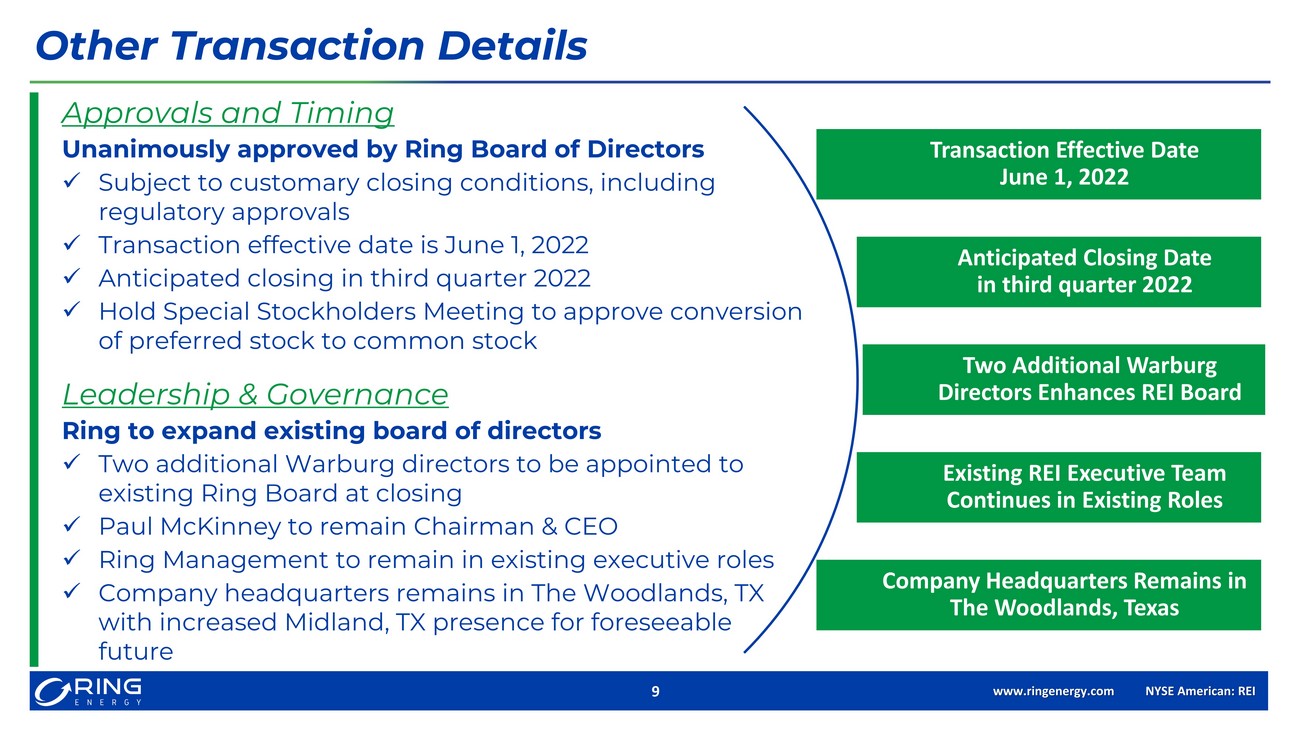
www.ringenergy.com NYSE American: REI 9 Approvals and Timing Unanimously approved by Ring Board of Directors x Subject to customary closing conditions, including regulatory approvals x Transaction effective date is June 1, 2022 x Anticipated closing in third quarter 2022 x Hold Special Stockholders Meeting to approve conversion of preferred stock to common stock Leadership & Governance Ring to expand existing board of directors x Two additional Warburg directors to be appointed to existing Ring Board at closing x Paul McKinney to remain Chairman & CEO x Ring Management to remain in existing executive roles x Company headquarters remains in The Woodlands, TX with increased Midland, TX presence for foreseeable future Other Transaction Details Transaction Effective Date June 1, 2022 Anticipated Closing Date in third quarter 2022 Two Additional Warburg Directors Enhances REI Board Existing REI Executive Team Continues in Existing Roles Company Headquarters Remains in The Woodlands, Texas
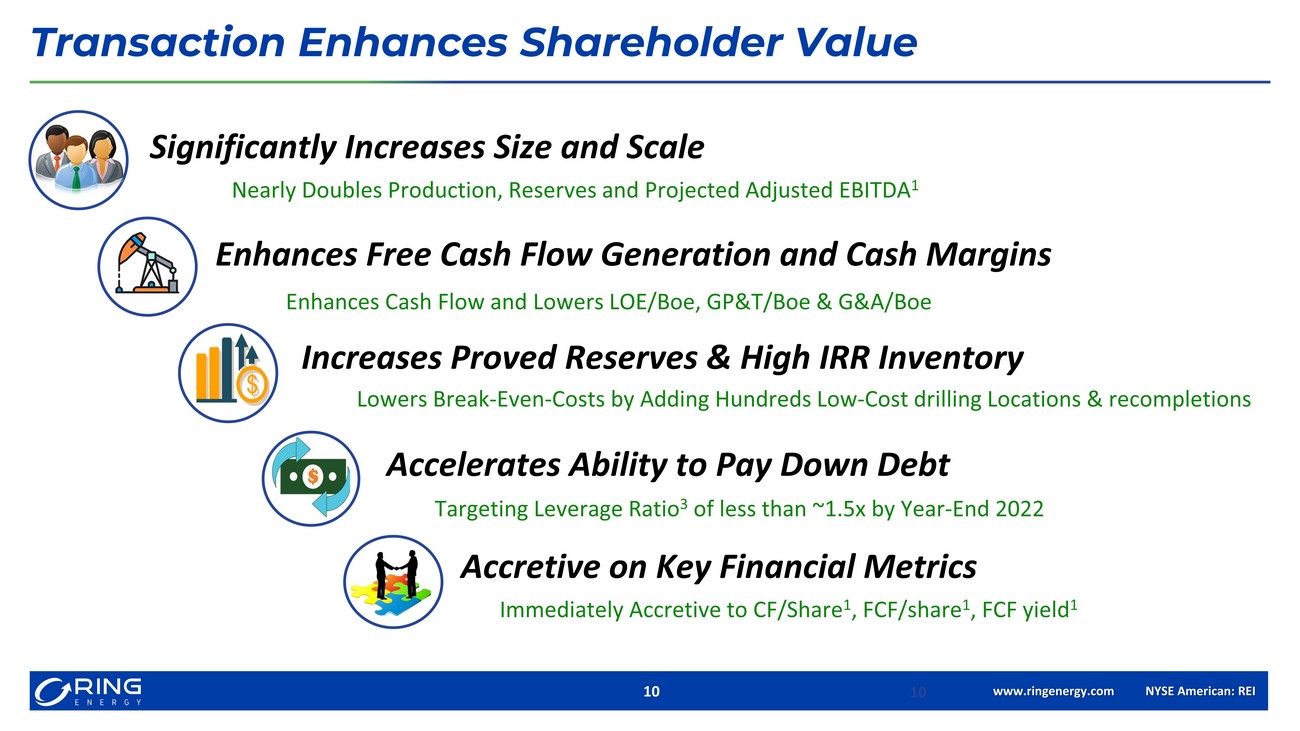
www.ringenergy.com NYSE American: REI 10 Significantly Increases Size and Scale Enhances Free Cash Flow Generation and Cash Margins Increases Proved Reserves & High IRR Inventory Accelerates Ability to Pay Down Debt Accretive on Key Financial Metrics Transaction Enhances Shareholder Value 10 Nearly Doubles Production, Reserves and Projected Adjusted EBITDA 1 Enhances Cash Flow and Lowers LOE/Boe, GP&T/Boe & G&A/Boe Lowers Break - Even - Costs by Adding Hundreds Low - Cost drilling Locations & recompletions Immediately Accretive to CF/Share 1 , FCF/share 1 , FCF yield 1 Targeting Leverage Ratio 3 of less than ~1.5x by Year - End 2022

ANALYST COVERAGE Alliance Global Partners (A.G.P.) Jeff Campbell (203) 577 - 5427 jcampbell@allianceg.com Tuohy Brothers Investment Noel Parks (215) 913 - 7320 nparks@tuohybrothers.com ROTH Capital Partners John M. White (949) 720 - 7115 jwhite@roth.com Truist Financial Neal Dingmann (713) 247 - 9000 neal.dingmann@truist.com COMPANY CONTACT Al Petrie (281) 975 - 2146 apetrie@ringenergy.com Chris Delange (281) 975 - 2146 cdelange @ringenergy.com

www. ringenergy.com NYSE American: REI APPENDIX
• June 21, 2022 NYMEX Strip Pricing for WTI /HH used throughout the presentation: 2022:$107.12 / $7.10; 2023: $92.89 / $5.35; 2 024 : $83.09 / $4.76; 2025: $76.31 / $4.63; 2026+: $71.68 / $4.62 • Based on NYMEX strip pricing as of June 21, 2022. Expected impact on Ring’s guidance is dependent upon the timing of closing, anti cip ated capital spending levels, and market conditions. Updated guidance will be provided after closing. 1. Represents a non - GAAP financial measure that should not be considered a substitute for any GAAP measure. See Non - GAAP Informati on. 2. Net production, Adjusted EBITDA & FCF are all unhedged projections at June 21, 2022 NYMEX Strip prices and compared to consen su s 3. Defined as total debt divided by trailing twelve months (“TTM”) Adjusted EBITDA 4. Source for REI standalone metrics for Q4 2022 is factset consensus +/ - 5% 5. Proved reserves for REI are management estimates as of June 1, 2022 and Stronghold estimates as of June 1, 2022 were prepared b y CGA, both used June 21, 2022 NYMEX Strip prices 6. The dilutive effect of restricted stock, stock options and warrants is calculated using the Treasury Stock method as of June 30 , 2022 Footnotes
Certain financial information utilized by the Company are not measures of financial performance recognized by accounting prin cip les generally accepted in the United States (“GAAP”). The Company defines Adjusted EBITDA as net income (loss) plus net interest expense, unrealized loss (gain) on change in fair val ue of derivatives, ceiling test impairment, income tax (benefit) expense, depreciation, depletion and amortization, asset retirement obligation accretion and share - based compensation. Company management believes this presentation is relevant and useful because it helps investors understand the Company’s operating performance and makes it easier to compare its results with those of other companies that have different fin ancing, capital and tax structures. Adjusted EBITDA should not be considered in isolation from or as a substitute for net income, as an indication of operating performance or cash flows from operating acti vit ies or as a measure of liquidity. Adjusted EBITDA, as the Company calculates it, may not be comparable to Adjusted EBITDA measures reported by other companies. In addition, Adjusted EBITDA does not represent funds ava ilable for discretionary use. The Company defines Free Cash Flow as Adjusted EBITDA (defined above) less net interest expense (excluding amortization of de fer red financing cost), capital expenditures and proceeds from divestiture of oil and natural gas properties. For this purpose, the Company’s definition of capital expenditures includes costs incurred related to oi l and natural gas properties (such as drilling and infrastructure costs and the lease maintenance costs) and equipment, furniture and fixtures, but excludes acquisition costs of oil and gas properties from third pa rties that are not included in the Company’s capital expenditures guidance provided to investors. Company management believes that Free Cash Flow is an important financial performance measure for use in evaluatin g t he performance and efficiency of its current operating activities after the impact of accrued capital expenditures and net interest expense and without being impacted by items such as changes associated with wor kin g capital, which can vary substantially from one period to another. There is no commonly accepted definition Free Cash Flow within the industry. Accordingly, Free Cash Flow, as defined and calculated by th e C ompany, may not be comparable to Free Cash Flow or other similarly named non - GAAP measures reported by other companies. While the Company includes net interest expense in the calculation of Free Cash Fl ow, other mandatory debt service requirements of future payments of principal at maturity (if such debt is not refinanced) are excluded from the calculation of Free Cash Flow. These and other non - discretionary expenditures that are not deducted from Free Cash Flow would reduce cash available for other uses. PV - 10 is a non - GAAP measure that differs from a measure under GAAP known as “standardized measure of discounted future net cash flows” in that PV - 10 is calculated without including future income taxes. Non - GAAP Information