RING ENERGY, INC.0001384195--12-312021FY0010019256285868287truefalse20846282falsefalseEide Bailly LLP2860001384195us-gaap:EmployeeStockOptionMember2021-01-012021-12-310001384195us-gaap:EmployeeStockOptionMember2019-01-012019-12-310001384195rei:CommonWarrantsMember2020-10-310001384195rei:CommonWarrantsMemberrei:RegisteredDirectOfferingMember2020-10-012020-10-310001384195rei:UnderwrittenPublicOfferingMember2020-10-012020-10-310001384195rei:PreFundedWarrantsMember2020-10-012020-10-310001384195us-gaap:RetainedEarningsMember2021-12-310001384195us-gaap:AdditionalPaidInCapitalMember2021-12-310001384195us-gaap:RetainedEarningsMember2020-12-310001384195us-gaap:AdditionalPaidInCapitalMember2020-12-310001384195us-gaap:RetainedEarningsMember2019-12-310001384195us-gaap:AdditionalPaidInCapitalMember2019-12-310001384195us-gaap:RetainedEarningsMember2018-12-310001384195us-gaap:AdditionalPaidInCapitalMember2018-12-310001384195us-gaap:CommonStockMember2021-12-310001384195us-gaap:CommonStockMember2020-12-310001384195us-gaap:CommonStockMember2019-12-310001384195us-gaap:CommonStockMember2018-12-310001384195rei:ExercisedOption1Member2021-12-310001384195rei:ExercisePriceTwoMember2021-01-012021-12-310001384195rei:ExercisePriceThreeMember2021-01-012021-12-310001384195rei:ExercisePriceSixMember2021-01-012021-12-310001384195rei:ExercisePriceOneMember2021-01-012021-12-310001384195rei:ExercisePriceFourMember2021-01-012021-12-310001384195rei:ExercisePriceFiveMember2021-01-012021-12-310001384195us-gaap:StockOptionMember2018-12-310001384195us-gaap:StockOptionMember2020-01-012020-12-310001384195us-gaap:StockOptionMember2019-01-012019-12-3100013841952020-06-300001384195rei:ExercisePriceTwoMember2021-12-310001384195rei:ExercisePriceThreeMember2021-12-310001384195rei:ExercisePriceSixMember2021-12-310001384195rei:ExercisePriceOneMember2021-12-310001384195rei:ExercisePriceFourMember2021-12-310001384195rei:ExercisePriceFiveMember2021-12-310001384195us-gaap:StockOptionMember2020-12-310001384195us-gaap:StockOptionMember2019-12-310001384195rei:OmnibusIncentivePlanMember2021-12-310001384195rei:LongTermIncentivePlanMember2021-12-310001384195us-gaap:RestrictedStockMember2020-12-310001384195us-gaap:PerformanceSharesMember2020-12-310001384195us-gaap:RestrictedStockMember2019-12-310001384195us-gaap:RestrictedStockMember2018-12-310001384195rei:RestrictedStockGrantDateTwelveMember2021-01-012021-12-310001384195rei:RestrictedStockGrantDateThirteenMember2021-01-012021-12-310001384195rei:RestrictedStockGrantDateTenMember2021-01-012021-12-310001384195rei:RestrictedStockGrantDateSixteenMember2021-01-012021-12-310001384195rei:RestrictedStockGrantDateSixMember2021-01-012021-12-310001384195rei:RestrictedStockGrantDateSeventeenMember2021-01-012021-12-310001384195rei:RestrictedStockGrantDateSevenMember2021-01-012021-12-310001384195rei:RestrictedStockGrantDateNineMember2021-01-012021-12-310001384195rei:RestrictedStockGrantDateFourteenMember2021-01-012021-12-310001384195rei:RestrictedStockGrantDateFourMember2021-01-012021-12-310001384195rei:RestrictedStockGrantDateFiveMember2021-01-012021-12-310001384195rei:RestrictedStockGrantDateFifteenMember2021-01-012021-12-310001384195rei:RestrictedStockGrantDateElevenMember2021-01-012021-12-310001384195rei:RestrictedStockGrantDateEightMember2021-01-012021-12-310001384195us-gaap:RestrictedStockMember2018-01-012018-12-310001384195us-gaap:StockOptionMember2021-01-012021-12-310001384195us-gaap:EmployeeStockOptionMember2021-01-012021-12-310001384195us-gaap:EmployeeStockOptionMember2020-01-012020-12-310001384195us-gaap:EmployeeStockOptionMember2019-01-012019-12-310001384195rei:WishboneAcquisitionMember2021-01-012021-12-310001384195rei:ChemicalServicesAgreementWithProJectChemicalsLlcMemberrei:Mr.MckinneyChiefExecutiveOfficerAndChairmanMember2021-01-012021-12-310001384195srt:MinimumMemberus-gaap:OfficeEquipmentMember2021-01-012021-12-310001384195srt:MinimumMemberus-gaap:LeaseholdImprovementsMember2021-01-012021-12-310001384195srt:MinimumMemberus-gaap:EquipmentMember2021-01-012021-12-310001384195srt:MaximumMemberus-gaap:OfficeEquipmentMember2021-01-012021-12-310001384195srt:MaximumMemberus-gaap:LeaseholdImprovementsMember2021-01-012021-12-310001384195srt:MaximumMemberus-gaap:EquipmentMember2021-01-012021-12-310001384195rei:StateAndFederalAgenciesMemberus-gaap:StandbyLettersOfCreditMember2021-12-310001384195rei:ElectricUtilityCompaniesMemberus-gaap:StandbyLettersOfCreditMember2021-12-3100013841952019-04-300001384195rei:ProJectHoldingsLlcMemberrei:Mr.MckinneyChiefExecutiveOfficerAndChairmanMember2021-06-300001384195us-gaap:RestrictedStockMember2021-12-310001384195us-gaap:PerformanceSharesMember2021-12-310001384195us-gaap:StockOptionMember2021-12-3100013841952020-06-012020-06-300001384195us-gaap:FairValueInputsLevel3Memberus-gaap:FairValueMeasurementsRecurringMember2021-12-310001384195us-gaap:FairValueInputsLevel2Memberus-gaap:FairValueMeasurementsRecurringMember2021-12-310001384195us-gaap:FairValueInputsLevel1Memberus-gaap:FairValueMeasurementsRecurringMember2021-12-310001384195us-gaap:FairValueMeasurementsRecurringMember2021-12-310001384195us-gaap:FairValueInputsLevel3Memberus-gaap:FairValueMeasurementsRecurringMember2020-12-310001384195us-gaap:FairValueInputsLevel2Memberus-gaap:FairValueMeasurementsRecurringMember2020-12-310001384195us-gaap:FairValueInputsLevel1Memberus-gaap:FairValueMeasurementsRecurringMember2020-12-310001384195us-gaap:FairValueMeasurementsRecurringMember2020-12-310001384195srt:NaturalGasReservesMember2020-01-012020-12-310001384195srt:MinimumMemberus-gaap:LondonInterbankOfferedRateLIBORMember2021-01-012021-12-310001384195srt:MaximumMemberus-gaap:LondonInterbankOfferedRateLIBORMember2021-01-012021-12-310001384195us-gaap:LondonInterbankOfferedRateLIBORMember2021-01-012021-12-310001384195us-gaap:FederalFundsPurchasedMember2021-01-012021-12-310001384195rei:AcquiredPropertiesMember2019-01-012019-12-310001384195rei:CustomerTwoMemberus-gaap:RevenueFromContractWithCustomerMemberus-gaap:CustomerConcentrationRiskMember2021-01-012021-12-310001384195rei:CustomerTwoMemberus-gaap:AccountsReceivableMemberus-gaap:CustomerConcentrationRiskMember2021-01-012021-12-310001384195rei:CustomerThreeMemberus-gaap:RevenueFromContractWithCustomerMemberus-gaap:CustomerConcentrationRiskMember2021-01-012021-12-310001384195rei:CustomerThreeMemberus-gaap:AccountsReceivableMemberus-gaap:CustomerConcentrationRiskMember2021-01-012021-12-310001384195rei:CustomerOneMemberus-gaap:RevenueFromContractWithCustomerMemberus-gaap:CustomerConcentrationRiskMember2021-01-012021-12-310001384195rei:CustomerOneMemberus-gaap:AccountsReceivableMemberus-gaap:CustomerConcentrationRiskMember2021-01-012021-12-310001384195rei:CustomerTwoMemberus-gaap:RevenueFromContractWithCustomerMemberus-gaap:CustomerConcentrationRiskMember2020-01-012020-12-310001384195rei:CustomerTwoMemberus-gaap:AccountsReceivableMemberus-gaap:CustomerConcentrationRiskMember2020-01-012020-12-310001384195rei:CustomerThreeMemberus-gaap:RevenueFromContractWithCustomerMemberus-gaap:CustomerConcentrationRiskMember2020-01-012020-12-310001384195rei:CustomerThreeMemberus-gaap:AccountsReceivableMemberus-gaap:CustomerConcentrationRiskMember2020-01-012020-12-310001384195rei:CustomerOneMemberus-gaap:RevenueFromContractWithCustomerMemberus-gaap:CustomerConcentrationRiskMember2020-01-012020-12-310001384195rei:CustomerOneMemberus-gaap:AccountsReceivableMemberus-gaap:CustomerConcentrationRiskMember2020-01-012020-12-310001384195rei:CustomerTwoMemberus-gaap:RevenueFromContractWithCustomerMemberus-gaap:CustomerConcentrationRiskMember2019-01-012019-12-310001384195rei:CustomerTwoMemberus-gaap:AccountsReceivableMemberus-gaap:CustomerConcentrationRiskMember2019-01-012019-12-310001384195rei:CustomerThreeMemberus-gaap:RevenueFromContractWithCustomerMemberus-gaap:CustomerConcentrationRiskMember2019-01-012019-12-310001384195rei:CustomerThreeMemberus-gaap:AccountsReceivableMemberus-gaap:CustomerConcentrationRiskMember2019-01-012019-12-310001384195rei:CustomerOneMemberus-gaap:RevenueFromContractWithCustomerMemberus-gaap:CustomerConcentrationRiskMember2019-01-012019-12-310001384195rei:CustomerOneMemberus-gaap:AccountsReceivableMemberus-gaap:CustomerConcentrationRiskMember2019-01-012019-12-310001384195rei:PreFundedWarrantsMember2020-12-310001384195rei:CommonWarrantsMember2021-12-310001384195rei:RegisteredDirectOfferingMember2020-10-3100013841952020-10-310001384195rei:WishbonePartnersLlcMember2019-02-250001384195rei:WishboneAcquisitionMember2019-02-250001384195rei:WishboneAcquisitionMemberrei:AverageWorkingInterestMember2019-04-090001384195rei:WishboneAcquisitionMemberrei:AverageNetRevenueInterestMember2019-04-090001384195rei:WishbonePartnersLlcMember2019-04-012019-04-300001384195rei:OilAndNaturalGasAssetsInAndrewsCountyMember2021-12-3100013841952018-12-310001384195us-gaap:RestrictedStockMember2021-01-012021-12-310001384195us-gaap:PhantomShareUnitsPSUsMember2021-01-012021-12-310001384195us-gaap:RestrictedStockMember2020-01-012020-12-310001384195us-gaap:RestrictedStockMember2019-01-012019-12-310001384195us-gaap:PerformanceSharesMember2021-01-012021-12-310001384195us-gaap:RetainedEarningsMember2019-01-012019-12-310001384195us-gaap:CommonStockMember2019-01-012019-12-310001384195us-gaap:AdditionalPaidInCapitalMember2019-01-012019-12-310001384195rei:ChemicalServicesAgreementWithProJectChemicalsLlcMemberrei:Mr.MckinneyChiefExecutiveOfficerAndChairmanMember2021-12-310001384195rei:WishboneAcquisitionMember2019-04-090001384195rei:CommonWarrantsMember2021-01-012021-12-310001384195rei:PreFundedWarrantsMember2021-01-012021-01-310001384195us-gaap:SuretyBondMember2021-12-310001384195us-gaap:RetainedEarningsMember2021-01-012021-12-310001384195us-gaap:CommonStockMember2021-01-012021-12-310001384195us-gaap:AdditionalPaidInCapitalMember2021-01-012021-12-310001384195rei:PreFundedWarrantsMemberrei:RegisteredDirectOfferingMember2020-10-012020-10-310001384195rei:CommonWarrantsMember2020-10-012020-10-310001384195us-gaap:PerformanceSharesMember2021-11-222021-11-220001384195rei:ExercisedOption1Member2021-01-012021-12-310001384195rei:CommonWarrantsMember2020-04-012020-04-300001384195us-gaap:RetainedEarningsMember2020-01-012020-12-310001384195us-gaap:CommonStockMember2020-01-012020-12-310001384195us-gaap:AdditionalPaidInCapitalMember2020-01-012020-12-310001384195rei:UnderwrittenPublicOfferingMember2021-01-012021-12-310001384195rei:RegisteredDirectOfferingMember2021-01-012021-12-3100013841952020-12-012020-12-310001384195rei:RegisteredDirectOfferingMember2020-10-012020-10-3100013841952020-10-012020-12-310001384195srt:OilReservesMemberus-gaap:CommodityContractMemberus-gaap:SubsequentEventMember2022-02-0100013841952020-10-012020-10-310001384195srt:MinimumMember2021-01-012021-12-310001384195srt:MaximumMember2021-01-012021-12-310001384195srt:MaximumMember2020-06-012020-06-300001384195rei:StateAndFederalAgenciesMemberus-gaap:StandbyLettersOfCreditMember2021-01-012021-12-310001384195us-gaap:SuretyBondMember2021-01-012021-12-3100013841952020-12-310001384195srt:MinimumMembersrt:OilReservesMemberus-gaap:CommodityContractMemberus-gaap:SubsequentEventMember2022-02-010001384195srt:MaximumMembersrt:OilReservesMemberus-gaap:CommodityContractMemberus-gaap:SubsequentEventMember2022-02-010001384195srt:OilReservesMemberrei:January2022ThroughDecember2022Memberrei:CommodityContractGMember2021-12-310001384195srt:OilReservesMemberrei:January2022ThroughDecember2022Memberrei:CommodityContractFMember2021-12-310001384195srt:OilReservesMemberrei:January2022ThroughDecember2022Memberrei:CommodityContractEMember2021-12-310001384195srt:OilReservesMemberrei:January2022ThroughDecember2022Memberrei:CommodityContractDMember2021-12-310001384195srt:OilReservesMemberrei:January2022ThroughDecember2022Memberrei:CommodityContractCMember2021-12-310001384195srt:OilReservesMemberrei:January2022ThroughDecember2022Memberrei:CommodityContractBMember2021-12-310001384195srt:OilReservesMemberrei:January2022ThroughDecember2022Memberrei:CommodityContractAMember2021-12-310001384195srt:OilReservesMemberrei:January2022ThroughDecember2022Memberrei:CommodityContractGMember2021-05-110001384195srt:OilReservesMember2021-01-012021-12-310001384195srt:NaturalGasReservesMember2021-01-012021-12-310001384195srt:OilReservesMember2020-01-012020-12-310001384195srt:OilReservesMember2019-01-012019-12-310001384195rei:VinFisherOperatingIncMember2021-12-3100013841952021-12-3100013841952019-12-310001384195rei:WishbonePartnersLlcMember2019-02-252019-02-250001384195rei:WishboneAcquisitionMember2019-04-092019-04-090001384195rei:VinFisherOperatingIncMember2021-01-012021-12-310001384195us-gaap:StandbyLettersOfCreditMember2021-01-012021-12-3100013841952020-01-012020-12-3100013841952019-01-012019-12-310001384195rei:BoardOfDirectorsMember2020-12-012020-12-310001384195rei:BoardOfDirectorsMember2020-10-012020-10-3100013841952021-06-3000013841952022-03-1600013841952021-01-012021-12-31xbrli:sharesiso4217:USDrei:BarrelOfButaneiso4217:USDutr:bblxbrli:purerei:itemrei:NotesSeriesiso4217:USDxbrli:sharesutr:acre

Table of Contents

United States

Securities and Exchange Commission

Washington, D.C. 20549

Form 10-K

(Mark One)

Annual Report Pursuant to Section 13 or 15(d) of the Securities Exchange Act of 1934

For the fiscal year ended December 31, 2021

Or

Transition Report pursuant to Section 13 or 15(d) of the Securities Exchange Act of 1934

For the transition period from               to               

Commission file number 001-36057

Ring Energy, Inc.

(Exact name of registrant as specified in its charter)

Nevada

90-0406406

(State or other jurisdiction of
incorporation or organization)

(I.R.S. Employer
Identification Number)

1725 Hughes Landing Blvd. Suite 900
The Woodlands, TX

77380

(Address of principal executive offices)

(Zip Code)

(281) 397-3699


(Registrant’s telephone number, including area code)


Securities registered under Section 12(b) of the Exchange Act:

Title of Each Class

Trading Symbol

Name of Exchange

Common Stock, par value $0.001

REI

NYSE American

Securities registered under Section 12(g) of the Exchange Act: None

Indicate by check mark if the registrant is a well-known seasoned issuer, as defined in Rule 405 of the Securities Act. Yes No

Indicate by check mark if the registrant is not required to file reports pursuant to Section 13 or 15(d) of the Act. Yes No

Indicate by check mark whether the registrant: (1) has filed all reports required to be filed by Section 13 or 15(d) of the Exchange Act during the preceding 12 months (or for such shorter period that the Registrant was required to file such reports), and (2) has been subject to such filing requirements for the past 90 days. Yes No

Indicate by check mark whether the registrant has submitted electronically every Interactive Data File required to be submitted pursuant to Rule 405 of Regulation S-T (§ 232.405 of this chapter) during the preceding 12 months (or for such shorter period that the registrant was required to submit such files). Yes No

Indicate by check mark whether the registrant is a large accelerated filer, an accelerated filer, a non-accelerated filer, or a smaller reporting company. See definitions of “large accelerated filer,” “accelerated filer,” and “smaller reporting company” in Rule 12b-2 of the Exchange Act.

Large accelerated filer


Accelerated filer

Non-accelerated filer

(Do not check if a smaller reporting company)

Smaller reporting company

If an emerging growth company, indicate by check mark if the registrant has elected not to use the extended transition period for complying with any new or revised financial accounting standards provided pursuant to Section 13(a) of the Exchange Act.

Indicate by check mark whether the registrant has filed a report on and attestation to its management’s assessment of the effectiveness of its internal control over financial reporting under Section 404(b) of the Sarbanes-Oxley Act (15 U.S.C. 7262(b)) by the registered public accounting firm that prepared or issued its audit report.

Indicate by check mark whether the registrant is shell company (as defined in Rule 12b-2 of the Act). Yes No

As of June 30, 2021, the aggregate market value of the common voting stock held by non-affiliates of the issuer, based upon the closing stock price on the NYSE American of $2.98 per share, was $254,767,528.

As of March 16, 2022, the issuer had outstanding 100,192,562 shares of common stock ($0.001 par value).

DOCUMENTS INCORPORATED BY REFERENCE

The information required by Part III of this Report, to the extent not set forth herein, is incorporated herein by reference from the registrant’s definitive proxy statement relating to the Annual Meeting of Stockholders to be held in 2021, which definitive proxy statement shall be filed with the Securities and Exchange Commission within 120 days after the end of the fiscal year to which this Report relates.

Table of Contents

TABLE OF CONTENTS

PART I

Item 1:

Business

4

Item 1A:

Risk Factors

17

Item 1B:

Unresolved Staff Comments

29

Item 2:

Properties

30

Item 3:

Legal Proceedings

41

Item 4:

Mine Safety Disclosures

41

PART II

Item 5:

Market for Registrant’s Common Equity, Related Stockholder Matters and Issued Purchases of Equity Securities

41

Item 6:

Reserved

42

Item 7:

Management’s Discussion and Analysis of Financial Condition and Results of Operations

43

Item 7A:

Quantitative and Qualitative Disclosures About Market Risk

51

Item 8:

Financial Statements and Supplementary Data

52

Item 9:

Changes in and Disagreement’s With Accountants on Accounting and Financial Disclosure

52

Item 9A:

Controls and Procedures

52

Item 9B:

Other Information

55

Item 9C:

Disclosure Regarding Foreign Jurisdictions that Prevent Inspections

55

PART III

Item 10:

Directors, Executive Officers and Corporate Governance

55

Item 11:

Executive Compensation

55

Item 12:

Security Ownership of Certain Beneficial Owners and Management and Related Stockholder Matters

55

Item 13:

Certain Relationships and Related Transactions, and Director Independence

55

Item 14:

Principal Accounting Fees and Services

55

PART IV

Item 15:

Exhibits, Financial Statement Schedules

56

2

Table of Contents

Forward Looking Statements

This Annual Report on Form 10-K (herein, “Annual Report”) contains forward-looking statements within the meaning of Section 27A of the Securities Act of 1933, as amended, and Section 21E of the Securities Exchange Act of 1934, as amended. All statements, other than statements of historical fact included in this Annual Report regarding our strategy, future operations, financial position, estimated revenues and losses, projected costs, prospects, plans and objectives of management are forward-looking statements. When used in this Annual Report, the words “may,” “will,” “could,” “would,” “should,” “believe,” “anticipate,” “intend,” “estimate,” “expect,” “plan,” “pursue,” “target,” “continue,” “potential,” “guidance,” “project” or other similar expressions are intended to identify forward-looking statements, although not all forward-looking statements contain such identifying words. All forward-looking statements speak only as of the date of this Annual Report. Although we believe that our plans, intentions and expectations reflected in or suggested by the forward-looking statements we make in this Annual Report are reasonable, we can give no assurance that these plans, intentions or expectations will be achieved. We are making investors aware that such forward-looking statements, because they relate to future events, are by their very nature subject to many important factors that could cause actual results to differ materially from those contemplated. Such factors include: declines or volatility in the prices we receive for our oil and natural gas; our ability to raise additional capital to fund future capital expenditures; our ability to generate sufficient cash flow from operations, borrowings or other sources to enable us to fully develop and produce our oil and natural gas properties; general economic conditions, whether internationally, nationally or in the regional and local market areas in which we do business; risks associated with drilling, including completion risks, cost overruns and the drilling of non-economic wells or dry holes; uncertainties associated with estimates of proved oil and natural gas reserves; the presence or recoverability of estimated oil and natural gas reserves and the actual future production rates and associated costs; risks and liabilities associated with acquired companies and properties; risks related to integration of acquired companies and properties; potential defects in title to our properties; cost and availability of drilling rigs, equipment, supplies, personnel and oilfield services; geological concentration of our reserves; environmental or other governmental regulations, including legislation of hydraulic fracture stimulation; our ability to secure firm transportation for oil and natural gas we produce and to sell the oil and natural gas at market prices; exploration and development risks; management’s ability to execute our plans to meet our goals; our ability to retain key members of our management team on commercially reasonable terms; the occurrence of cybersecurity incidents, attacks or other breaches to our information technology systems or on systems and infrastructure used by the oil and gas industry; weather conditions; actions or inactions of third-party operators of our properties; costs and liabilities associated with environmental, health and safety laws; our ability to find and retain highly skilled personnel; operating hazards attendant to the oil and natural gas business; competition in the oil and natural gas industry; evolving geopolitical and military hostilities in the Middle East, Russia and Ukraine; the ongoing COVID-19 pandemic, including any reactive or proactive measures taken by businesses, governments and by other organizations related thereto, and the direct and indirect effects of COVID-19 on the market for and price of oil;  and the other factors discussed in Part I, Item 1A-- “Risk Factors” in this Annual Report, as well as in our consolidated financial statements, related notes, and the other financial information appearing elsewhere in this Annual Report and our other reports filed from time to time with the Securities and Exchange Commission (the “SEC”).

Readers are cautioned not to place undue reliance on forward-looking statements, which speak only as of the date that such statements are made. We undertake no obligation to publicly update or revise any forward-looking statements after the date they are made, whether as a result of new information, future events or otherwise.

Unless the context otherwise requires, references in this Annual Report to “Ring,” “Ring Energy,” the “Company,” “we,” “us,” “our” or “ours” refer to Ring Energy, Inc.

3

Table of Contents

PART I

Item 1:

Business

General

Ring Energy, Inc., a Nevada corporation (“Ring,” “Ring Energy,” the “Company,” “we,” “us,” “our,” or similar terms), is a growth oriented independent exploration and production company based in The Woodlands, Texas and is engaged in oil and natural gas development, production, acquisition, and exploration activities currently focused in Texas and New Mexico. Our primary drilling operations target the oil and liquids rich producing formations in the Northwest Shelf, the Central Basin Platform, and the Delaware Basin all of which are part of the Permian Basin in Texas and New Mexico.

As of December 31, 2021, our leasehold acreage positions totaled 83,604 gross (64,380 net) acres and we held interests in 491 gross (333 net) producing wells. Proved reserves as of December 31, 2021 were approximately 77.8 million BOE (barrel of oil equivalent), of which we are the operator of approximately 98%.  All of our properties are located in the Permian Basin in Texas and New Mexico. The Company’s proved reserves are oil-weighted with approximately 85% consisting of oil and 15% consisting of natural gas. Of those reserves, approximately 56% are classified as proved developed or “PD” and 44% are classified as proved undeveloped, or “PUD.” For the calculation of BOE, oil is weighted on a 6 to 1 ratio against natural gas.

Our Mission

Ring’s mission is to deliver competitive and sustainable returns to its shareholders by developing, acquiring, exploring for, and commercializing oil and natural-gas resources vital to the world’s health and welfare.

Our Business Strategy

Successfully achieving Ring’s mission requires a firm commitment to operating safely in a socially responsible and environmentally friendly manner. Key principles supporting Ring’s strategic vision are to:

ensure health, safety, and environmental excellence and a strong commitment to Ring’s employees and the communities in which we work and operate;
continue our focus on generating free cash flow to improve and build a sustainable financial foundation;
pursue rigorous capital discipline focused on Ring’s highest returning opportunities;
improve margins and drive value by targeting additional operating cost reductions and capital efficiencies; and
strengthen the balance sheet by steadily paying down debt, divesting of non-core assets and becoming a peer leader in Debt/EBITDA metrics.

Our strategic vision is guided by these key principles and implemented by pursuing the following five strategic objectives.

Attract and retain highly qualified people - Achieving our mission will only be possible through our employees. It is critical to have compensation, development, and human resource programs that attract, retain and motivate the types of people we need to succeed.

Pursue operational excellence with a sense of urgency - We plan to deliver low cost, consistent, timely and efficient execution of our drilling campaigns, work programs and operations. We will execute our operations in a safe and environmentally responsible manner, focus on reducing our emissions, apply advanced technologies, and continuously seek ways to reduce our operating cash costs on a per barrel basis. This objective is a foundational aspect of our culture and future success.

4

Table of Contents

Invest in high-margin, high rate-of-return projects - Another key to achieving our mission will be to prioritize our work programs and allocate capital to the highest return opportunities in our inventory. This objective is key to profitably growing our production and reserve levels and generating the excess cash from operations to pay down debt.

Focus on generating free cash flow and strengthen our balance sheet - Ring intends to reduce its long-term debt through the use of excess cash from operations and potentially through the sale of non-core assets. Continuing to generate free cash flow through a disciplined capital allocation program and reducing our operating and corporate costs are key components of this objective. Our capital program will be funded by operational cash flow and limited to balance our production and reserve growth versus paying down debt. Remaining focused and disciplined in this regard will lead to meaningful returns for our shareholders and provide additional financial flexibility to manage potential future swings in the business cycle. Our commodity hedges are designed to help ensure the necessary cash flow to adhere to these plans while retaining the flexibility to participate in prevailing commodity markets.

Pursue strategic acquisitions that maintain or reduce our break-even costs - We will actively pursue accretive acquisitions, mergers and dispositions that improve our margins, returns, and break-even costs of our investment portfolio. Financial strategies associated with these efforts will focus on delivering competitive debt-adjusted per share returns. This objective is key to delivering competitive returns to our shareholders on a sustainable basis.

2019 Acquisition

In 2019, a significant portion of the increase in acreage and reserves was the result of our acquisition of properties from Wishbone Energy Partners, LLC, Wishbone Texas Operating Company LLC and WB WaterWorks LLC on the Northwest Shelf in Gaines, Yoakum, Runnels and Coke Counties, Texas and Lea County, New Mexico that was completed in April 2019.  This acquisition contributed all of the acreage we have on the Northwest Shelf. It also contributed approximately 45.3 million BOE of our 81.1 million BOE of proved reserves as of December 31, 2019.

Appointment of Certain Officers and Directors

On March 24, 2021, the Company’s board of directors appointed Travis Thomas as Chief Financial Officer.

Primary Business Operations

The Company seeks to rigorously manage its asset portfolio to optimize shareholder value over the long term. As the weak commodity price environment began to recover and the contraction in oil demand seen from the COVID-19 pandemic began to ease, Ring initiated its Phase I four well program in the Northwest Shelf Asset by drilling two wells in December 2020 and two wells in January 2021.  All four wells were completed and placed on production during first quarter 2021.  During that quarter, the Company also performed nine conversions from electrical submersible pumps to rod pumps (such conversions, “CTRs”) with seven performed in the Northwest Shelf and two in the Central Basin Platform. New wells were added throughout the year by drilling in phases, to ensure the Company would continue operating within cash flow.  In the second quarter of 2021, the Company completed its Phase II drilling program and placed on production three new horizontal San Andres wells in the Northwest Shelf, along with four additional CTRs in the Northwest Shelf and one CTR in the Central Basin Platform. In third quarter 2021, the Phase III drilling program resulted in two horizontal San Andres wells in Northwest Shelf and two horizontal San Andres wells in the Central Basin Platform. During the third quarter of 2021, the Company also performed seven CTRs in the Northwest Shelf and three CTRs in the Central Basin Platform.  In the fourth quarter of 2021, the Company drilled one new well and performed one CTR in the Northwest Shelf and drilled one new well in the Central Basin Platform.  Lastly, during 2021 the Company participated with offset operators in two wells in the Northwest Shelf Asset as a non-operating working interest owner.

Ring believes that there is significant value to be created by drilling the identified undeveloped opportunities on its Texas and New Mexico properties and intends to focus its drilling efforts in 2022 primarily in the Northwest Shelf and Central Basin Platform.

Northwest Shelf – Yoakum, Runnels and Coke Counties, Texas and Lea County, New Mexico – As of December 31, 2021, Ring owned interests in a total of 17,950 gross (13,662 net) developed acres and 17,860 gross (11,993 net) undeveloped acres. In these counties, the Company has 79 identified proved horizontal drilling locations and 11 proved vertical drilling locations based on the reserve reports as of December 31, 2021. We believe the Northwest Shelf leases contain additional potential drilling locations.

5

Table of Contents

Central Basin Platform – Andrews and Gaines Counties, Texas – As of December 31, 2021, Ring owned interests in a total of 24,203 gross (18,882 net) developed acres and 4,862 gross (1,406 net) undeveloped acres. In these counties, the Company has two identified proved vertical drilling locations and 38 identified proved horizontal locations based on the reserve reports as of December 31, 2021. We believe the Central Basin Platform leases contain additional potential drilling locations.
Delaware Basin – Culberson and Reeves Counties, Texas – As of December 31, 2021, Ring owned interests in a total of 18,729 gross (18,437 net) developed acres. In these counties, the Company has five identified proved vertical drilling locations and four identified proved horizontal locations based on the reserve reports as of December 31, 2021. We believe the Delaware Basin leases contain additional potential drilling locations.

Ring intends to grow its reserves and production through development, drilling, exploitation and exploration activities on this multi-year project inventory of identified potential drilling locations and through acquisitions that meet the Company’s strategic and financial objectives, targeting oil-weighted reserves.

Ring Energy’s Strengths

high quality asset base in one of North America’s leading oil and gas producing regions characterized by low declines and attractive margins;
de-risked Permian Basin acreage position with multi-year drilling inventory of horizontal and vertical development potential;
concentrated acreage position with high degree of operational control;
experienced and proven management team focused on the Permian Basin;
history of attracting technical personnel with experience in our core area of operations;
commitment to cost efficient operations, health, safety, protecting the environment, our employees, and the communities in which we work and operate.

Competitive Business Conditions

We operate in a highly competitive environment for acquiring properties, marketing oil and natural gas and securing trained personnel. Some of our competitors possess and employ financial resources substantially greater than ours and some of our competitors employ more technical personnel. These factors can be particularly important in the areas in which we operate. Those companies may be able to pay more for productive oil and natural gas properties and exploratory prospects, and to evaluate, bid for, and purchase a greater number of properties and prospects than what our financial or technical resources permit. Our ability to acquire additional properties and to find and develop reserves in the future will depend on our ability to identify, evaluate and select suitable properties and to consummate transactions in a highly competitive environment.

Marketing and Pricing

The actual price range of crude oil is largely established by major crude oil purchasers and commodities trading. Pricing for natural gas is based on regional supply and demand conditions. To this extent, we believe we receive oil and natural gas prices comparable to other producers. We believe there is little risk in our ability to sell our production at prevailing prices. We view potential declines in oil and gas prices to a level which could render our current production uneconomical as our primary pricing risk.

We are presently committed to use the services of the existing gathering systems of the companies that purchase our natural gas production. This commitment is tied to existing natural gas purchase contracts associated with our production, which potentially gives such gathering companies certain short-term relative monopolistic powers to set gathering and transportation costs. Obtaining the services of an alternative gathering company would require substantial additional costs (since an alternative gathering company would be required to lay new pipeline and/or obtain new rights of way to any lease from which we are selling production).

We are not subject to third-party gathering systems with respect to our oil production. Some of our oil production is sold through a third-party pipeline which has no regional competition and all other oil production is transported by the oil purchaser by trucks with competitive trucking costs in the area.

6

Table of Contents

Major Customers

We principally sell our oil and natural gas production to end users, marketers and other purchasers that have access to nearby pipeline facilities. In areas where there is no practical access to pipelines, oil is trucked to storage facilities.

For the fiscal year ended December 31, 2021, sales to three customers, Phillips 66 Company (“Phillips”), NGL Crude Partners (“NGL Crude”), and BP Energy Company (“BP”) represented 76%, 7% and 6%, respectively, of our oil and natural gas revenues. As of December 31, 2021, Phillips represented 75% of our accounts receivable, NGL Crude represented 8% of our accounts receivable and BP represented 4% of our accounts receivable. We believe that the loss of any of these customers would not materially impact our business because we could readily find other purchasers for our oil and natural gas.

Delivery Commitments

As of December 31, 2021, we were not committed to providing a fixed quantity of oil or gas under any existing contracts.

Governmental Regulations

Oil and natural gas operations such as ours are subject to various types of legislation, regulation and other legal requirements enacted by governmental authorities. This legislation and regulation affecting the oil and natural gas industry is under constant review for amendment or expansion. Some of these requirements carry substantial penalties for failure to comply. The regulatory burden on the oil and natural gas industry increases our cost of doing business and, consequently, can affect our profitability.

Regulation of Drilling and Production

The production of oil and natural gas is subject to regulation under a wide range of local, state and federal statutes, rules, orders and regulations. Federal, state and local statutes and regulations require permits for drilling operations, drilling bonds and reports concerning operations. The trend in oil and natural gas regulation has been to increase regulatory restrictions and limitations on such activities. Any changes in, or more stringent enforcement of, these laws and regulations may result in delays or restrictions in permitting or development of projects or more stringent or costly construction, drilling, water management or completion activities or waste handling, storage, transport, remediation, or disposal emission or discharge requirements which could have a material adverse effect on the Company. For example, in January 2021, President Biden signed an Executive Order directing the Department of Interior (the “DOI”) to temporarily pause new oil and gas leases on federal lands and waters pending completion of a comprehensive review of the federal government’s existing oil and gas leasing and permitting program. In June 2021, a federal district court enjoined the DOI from implementing the pause and leasing resumed, although litigation over the leasing pause remains ongoing. In February 2022, another judge ruled that the Biden Administration’s efforts to raise the cost of climate change in its environmental assessments, would increase energy costs and damage state revenues from energy production. This ruling has cause federal agencies to delay issuing new oil and gas leases and permits on federal lands and waters. The Biden Administration has also announced that it intends to review the Trump Administration’s 2017 repeal of the 2015 rule regulating hydraulic fracturing activities in federal land under the Presidential Executive Order on Protecting Public Health and the Environment and Restoring Science to Tackle the Climate Crisis. While we do not have a significant federal lands acreage position (240 net acres as of December 31, 2021), these actions could have a material adverse effect on our industry and the Company.

Currently, all of our properties and operations are in Texas and New Mexico, which have regulations governing conservation matters, such as the unitization or pooling of oil and natural gas properties, the establishment of maximum allowable rates of production from oil and natural gas wells, the regulation of well spacing, and plugging and abandonment of wells. The effect of these regulations is to limit the amount of oil and natural gas that we can produce from our wells and to limit the number of wells or the locations at which we can drill, although we can apply for exceptions to such regulations or to have reductions in well spacing. Moreover, both Texas and New Mexico impose a production or severance tax with respect to the production and sale of oil, natural gas and natural gas liquids within their jurisdictions.

The failure to comply with these rules and regulations can result in substantial penalties. Our competitors in the oil and natural gas industry are subject to the same regulatory requirements and restrictions that affect our operations.

7

Table of Contents

Regulation of Transportation of Oil

Sales of crude oil, condensate and natural gas liquids are not currently regulated and are made at negotiated prices, however, Congress could reenact price controls in the future.

Our sales of crude oil are affected by the availability, terms and cost of transportation. The transportation of oil in common carrier pipelines is also subject to rate regulation. The Federal Energy Regulatory Commission, (“FERC”), regulates interstate oil pipeline transportation rates under the Interstate Commerce Act. Intrastate oil pipeline transportation rates are subject to regulation by state regulatory commissions. The basis for intrastate oil pipeline regulation, and the degree of regulatory oversight and scrutiny given to intrastate oil pipeline rates, varies from state to state. Insofar as effective interstate and intrastate rates are equally applicable to all comparable shippers, we believe that the regulation of oil transportation rates will not affect our operations in any way that is of material difference from those of our competitors. Further, interstate and intrastate common carrier oil pipelines must provide service on a non-discriminatory basis. Under this open access standard, common carriers must offer service to all shippers requesting service on the same terms and under the same rates. When oil pipelines operate at full capacity, access is governed by pro-rationing provisions set forth in the pipelines’ published tariffs. Accordingly, we believe that access to oil pipeline transportation services generally will be available to us to the same extent as to our competitors.

Regulation of Transportation and Sale of Natural Gas

Historically, the transportation and sale for resale of natural gas in interstate commerce have been regulated pursuant to the Natural Gas Act of 1938 (“NGA”), the Natural Gas Policy Act of 1978 (“NGPA”) and regulations issued under those Acts by the FERC. In the past, the federal government has regulated the prices at which natural gas could be sold. While sales by producers of natural gas can currently be made at uncontrolled market prices, Congress could reenact price controls in the future.

Since 1985, the FERC has endeavored to make natural gas transportation more accessible to natural gas buyers and sellers on an open and non-discriminatory basis. The FERC has stated that open access policies are necessary to improve the competitive structure of the interstate natural gas pipeline industry and to create a regulatory framework that will put natural gas sellers into more direct contractual relations with natural gas buyers by, among other things, unbundling the sale of natural gas from the sale of transportation and storage services. Although the FERC’s orders do not directly regulate natural gas producers, they are intended to foster increased competition within all phases of the natural gas industry.

We cannot accurately predict whether the FERC’s actions will achieve the goal of increasing competition in markets in which our natural gas is sold. Therefore, we cannot provide any assurance that the less stringent regulatory approach established by the FERC will continue. However, we do not believe that any action taken will affect us in a way that materially differs from the way it affects other natural gas producers.

Intrastate natural gas transportation is subject to regulation by state regulatory agencies. The basis for intrastate regulation of natural gas transportation and the degree of regulatory oversight and scrutiny given to intrastate natural gas pipeline rates and services varies from state to state. Insofar as such regulation within a particular state will generally affect all intrastate natural gas shippers within the state on a comparable basis, we believe that the regulation of similarly situated intrastate natural gas transportation in any states in which we operate and ship natural gas on an intrastate basis will not affect our operations in any way that is of material difference from those of our competitors.

Environmental Compliance and Risks

Our oil and natural gas exploration, development and production operations are subject to stringent federal, state and local laws and regulations governing the discharge of materials into the environment or otherwise relating to environmental protection. At the federal level, among the more significant laws that may affect our business and the oil and natural gas industry generally are: the Comprehensive Environmental Response, Compensation and Liability Act of 1980 (“CERCLA”); the Oil Pollution Act of 1990 (“OPA”); the Resource Conservation and Recovery Act (“RCRA”); the Clean Air Act (“CAA”); Federal Water Pollution Control Act of 1972, or the Clean Water Act (“CWA”); and the Safe Drinking Water Act of 1974 (“SWDA”). These federal laws are administered by the United States Environmental Protection Agency (“EPA”). Generally, these laws (i) regulate air and water quality, impose limitations on the discharge of pollutants and establish standards for the handling of solid and hazardous wastes; (ii) subject our operations to certain permitting and registration requirements; (iii) require remedial measures to mitigate pollution from former or

8

Table of Contents

ongoing operations; and (iv) may result in the assessment of administrative, civil and criminal penalties for failure to comply with such laws. In addition, there is environmental regulation of oil and gas production by state and local governments in the jurisdictions where we operate. As described below, there are various regulations issued by the EPA and other governmental agencies pursuant to these federal statutes that govern our operations.

In Texas and New Mexico, specific oil and natural gas regulations apply to oil and gas operations, including the drilling, completion and operations of wells, and the disposal of waste oil and saltwater. There are also procedures incident to the plugging and abandonment of dry holes or other non-operational wells, all as governed by the applicable governing state agency.

At the federal level, among the more significant laws and regulations that may affect our business and the oil and natural gas industry are:

Hazardous Substances and Wastes

CERCLA, also known as the Superfund law, and analogous state laws impose liability on certain classes of persons, known as “potentially responsible parties,” for the disposal or release of a regulated hazardous substance into the environment. These potentially responsible parties include (1) the current owners and operators of a facility, (2) the past owners and operators of a facility at the time the disposal or release of a hazardous substance occurred, (3) parties that arranged for the offsite disposal or treatment of a hazardous substance, and (4) transporters of hazardous substances to off-site disposal or treatment facilities. While petroleum and natural gas liquids are not designated as a “hazardous substance” under CERCLA, other chemicals used in or generated by our operations may be regulated as hazardous substances. Potentially responsible parties under CERCLA may be subject to strict, joint and several liability for the costs of investigating and cleaning up environmental contamination, for damages to natural resources and for the costs of certain health studies. In addition to statutory liability under CERCLA, common law claims for personal injury or property damage can also be brought by neighboring landowners and other third parties related to contaminated sites.

RCRA, and comparable state statutes and their implementing regulations, regulate the generation, transportation, treatment, storage, disposal and cleanup of solid and hazardous wastes. Under a delegation of authority from the EPA, most states administer some or all of the provisions of RCRA, sometimes in conjunction with their own, more stringent requirements. Federal and state regulatory agencies can seek to impose administrative, civil and criminal penalties for alleged non-compliance with RCRA and analogous state requirements. Certain wastes associated with the production of oil and natural gas, as well as certain types of petroleum-contaminated media and debris, are excluded from regulation as hazardous waste under Subtitle C of RCRA. These wastes, instead, are regulated as solid waste (i.e. non-hazardous waste) under the less stringent provisions of Subtitle D of RCRA. It is possible, however, that certain wastes now classified as non-hazardous could be classified as hazardous wastes in the future and therefore be subject to more rigorous and costly disposal requirements. Legislation has been proposed from time to time in Congress to regulate certain oil and natural gas wastes as hazardous waste under RCRA. Any such change could result in an increase in our costs to manage and dispose of wastes, which could have a material adverse effect on our consolidated results of operations and financial position.

Under CERCLA, RCRA and analogous state laws, we could be required to remove or remediate environmental impacts on properties we currently own and lease or formerly owned or leased (including hazardous substances or wastes disposed of or released by prior owners or operators), to clean up contaminated off-site disposal facilities where our wastes have come to be located or to implement remedial measures to prevent or mitigate future contamination. Compliance with these laws may constitute a significant cost and effort for us. No specific accounting for environmental compliance has been maintained or projected by us at this time. We are not presently aware of any environmental demands, claims, or adverse actions, litigation or administrative proceedings in which either we or our acquired properties are involved in or subject to, or arising out of any predecessor operations.

9

Table of Contents

Air Emissions

Our operations are subject to the CAA and comparable state and local laws and regulations, which regulate emissions of air pollutants from various sources and mandate certain permitting, monitoring, recordkeeping and reporting requirements. The CAA and its implementing regulations may require that we obtain permits prior to the construction, modification or operation of certain projects or facilities expected to produce or increase air emissions above certain threshold levels and strictly comply with those permits, including emissions and operational limitations. These permits may require us to install emission control technologies to limit emissions, which can impose significant costs on our business. In 2012 and 2016, the EPA issued New Source Performance Standards to regulate emissions of sources of volatile organic compounds (“VOCs”), sulfur dioxide, air toxics and methane from various oil and natural gas exploration, production, processing and transportation facilities. On May 12, 2016, the EPA amended its regulations to impose new standards for methane and volatile organic compounds emissions for certain new, modified, and reconstructed equipment, processes, and activities across the oil and natural gas sector. However, in a March 28, 2017 executive order, the Trump Administration directed the EPA to review the 2016 regulations and, if appropriate, to initiate a rule making to rescind or revise them consistent with the stated policy of promoting clean and safe development of the nation’s energy resources, while at the same time avoiding regulatory burdens that unnecessarily encumber energy production. In September 2020, the EPA finalized amendments to the 2016 standards that removed the transmission and storage segment from the oil and natural gas source category and rescinded the methane-specific requirements for production and processing facilities. However, President Biden signed an executive order on his first day in office calling for the suspension, revision, or rescission of the September 2020 rule and the reinstatement or issuance of methane emission standards for new, modified, and existing oil and gas facilities. Given the long-term trend toward increasing regulation, future federal Greenhouse Gas (“GHG”) regulations of the oil and gas industry remain a possibility, and several states have separately imposed their own regulations on methane emissions from oil and gas production activities. In November 2021, the EPA proposed new source performance standards and emissions guidelines to reduce methane and other pollution from new and existing sources in the oil and gas industry. The proposed rule would include, among other things, a comprehensive monitoring program for new and existing well sites, zero-emissions standards for new and existing pneumatic controls, and standards to eliminate venting of associated gas and requirements for the capture and sale of natural gas where a sales line is available. If adopted, these requirements could increase our costs to operate and control pollution. These standards, as well as any future laws and their implementing regulations, may require us to obtain pre-approval for the expansion or modification of existing facilities or the construction of new facilities expected to produce air emissions, impose stringent air permit requirements, or mandate the use of specific equipment or technologies to control emissions. Until these rules are formally adopted, we cannot predict the final regulatory requirements or the cost to comply with such requirements with any certainty.

In October 2015, the EPA announced that it was lowering the primary National Ambient Air Quality Standards (“NAAQS”) for ozone from 75 parts per billion to 70 parts per billion. Since that time, the EPA has issued area designations with respect to ground-level ozone. In December 2020, the EPA announced its intention to leave the ozone NAAQS unchanged at 70 parts per billion rather than lower them further. However, as discussed above, that action could be subject to reversal following the Biden Administration’s January 2021 executive order. In 2022, the New Mexico Environment Department is expected to issue final rules imposing more stringent limits on ozone pollution from the oil and gas industry operating in the state. Reclassification of areas of state implementation of the revised NAAQS could result in stricter permitting requirements, delay, or prohibit our ability to obtain such permits, and result in increased expenditures for pollution control equipment, the costs of which could be significant.

Moreover, the NMOCD recently adopted new rules, which require oil and gas operators to capture 98 percent of their natural gas waste by the end of 2026. The new rules went into effect on May 25, 2021. While the State of Texas has not formally conducted a recent rulemaking related to air emissions, scrutiny of oil and natural gas operations and the rules affecting them have increased in recent years. For example, the EPA and environmental non-governmental organizations have conducted flyovers with optical gas imaging cameras to survey emissions from oil and natural gas production facilities and transmission infrastructure. In addition, the RRC has increased oversight related to flaring, with reporting reviews and site inspections. While none of these activities increases our compliance obligations, they signal the potential for increased enforcement and possible rulemaking in the future.

Oil Pollution Prevention

The OPA amended the CWA to impose liability for releases of crude oil from vessels or facilities into navigable waters. If a release of crude oil into navigable waters occurs during shipment or from an oil terminal, we could be subject to liability under the OPA. In 1973, the EPA adopted oil pollution prevention regulations under the CWA. These oil pollution prevention regulations require the preparation of a Spill Prevention Control and Countermeasure (“SPCC”) plan for facilities engaged in drilling, producing, gathering,

10

Table of Contents

storing, processing, refining, transferring, distributing, using, or consuming crude oil and oil products, and which due to their location, could reasonably be expected to discharge oil in harmful quantities into or upon the navigable waters of the United States. SPCC requirements under the CWA require appropriate containment berms and similar structures to help prevent the discharge of pollutants into regulated waters in the event of a crude oil or other constituent tank spill, rupture or leak. The SPCC regulations require affected facilities to prepare a written, site-specific SPCC plan, which details how a facility’s operations comply with the requirements of the pollution prevention regulations. To be in compliance, the facility’s SPCC plan must satisfy all of the applicable requirements for drainage, bulk storage tanks, tank car and truck loading and unloading, transfer operations (intra-facility piping), inspections and records, security, and training. Most importantly, the facility must fully implement the SPCC plan and train personnel in its execution. Where applicable, we maintain and implement SPCC plans for our facilities.

Water Discharges

The CWA and analogous state laws and regulations impose restrictions and strict controls regarding the discharge of pollutants into navigable waters, defined as waters of the United States (“WOTUS”), as well as state waters. The CWA prohibits the placement of dredge or fill material in wetlands or other WOTUS unless authorized by a permit issued by the U.S. Army Corps of Engineers (“Corps”) or a delegated state agency pursuant to Section 404. In addition, the CWA and analogous state laws require individual permits or coverage under general permits for discharges of storm water runoff from certain types of facilities. Some states also maintain groundwater protection programs that require permits for discharges or operations that may impact groundwater conditions. Also, in June 2016, the EPA issued a final rule implementing wastewater pretreatment standards that prohibit onshore unconventional oil and natural gas extraction facilities from sending wastewater to publicly owned treatment works. This restriction of disposal options for hydraulic fracturing waste and other changes to CWA requirements may result in increased costs. Federal and state regulatory agencies can impose administrative, civil and criminal penalties for non-compliance with discharge permits or other requirements of the CWA and analogous state laws and regulations.

The scope of EPA’s and the Corps’ regulatory authority under Section 404 of the CWA has been the subject of extensive litigation and frequently changing regulations. The EPA issued a final rule in September 2015 that attempted to clarify the federal jurisdictional reach over WOTUS under Section 404 of the CWA. The EPA and the Corps issued a final rule in January 2018 staying implementation of the 2015 WOTUS rule for two years. On October 22, 2019, EPA and the Corps published a final rule repealing the 2015 WOTUS rule. The EPA and the Corps replaced the 2015 WOTUS rule by promulgating the Navigable Waters Protection Rule on April 21, 2020, which provides a revised definition of WOTUS and became effective on June 22, 2020.  These regulations have been challenged in federal court, however, and the scope of the CWA’s jurisdiction may remain fluid until all litigation is concluded. Further regulatory changes are likely, as the current administration has announced that it intends to review the Navigable Waters Protection Rule under the January 20, 2021 Executive Order on Protecting Public Health and the Environment and Restoring Science to Tackle the Climate Crisis. In November 2021, the EPA and the Corps issued a proposed rule to broaden the applicability of the definition of WOTUS. The agencies did not announce a date for official publication in the Federal Register of the new rule. However, future rulemakings regarding the definition of WOTUS will likely be subject to litigation. As a result of these developments, the scope of federal jurisdiction under the Clean Water Act is uncertain at this time. The pending litigation and future regulations concerning the definition of WOTUS may result in an expansion of the scope of the CWA’s jurisdiction, and we could face increased costs and delays with respect to obtaining permits for dredge and fill activities in WOTUS in connection with our operations.

Underground Injection Control

The underground injection of crude oil and natural gas wastes is regulated by the Underground Injection Control (“UIC”) program, as authorized by the SDWA, as well as by state programs. The primary objective of injection well operating requirements is to ensure the mechanical integrity of the injection apparatus and to prevent migration of fluid from the injection zone into underground sources of drinking water, as well as to prevent communication between injected fluids and zones capable of producing hydrocarbons. The SDWA establishes requirements for permitting, testing, monitoring, recordkeeping, and reporting of injection well activities, as well as a prohibition against the migration of fluid containing contaminants into underground sources of drinking water. Any leakage from the subsurface portions of the injection wells could cause degradation of fresh groundwater resources, potentially resulting in the suspension of permits, issuance of fines and penalties from governmental agencies, incurrence of expenditures for remediation of the affected resource and imposition of liability by third parties for property damages and personal injuries.

Under the auspices of the federal UIC program as implemented by states with UIC primacy, regulators, particularly at the state level, are becoming increasingly sensitive to possible correlations between underground injection and seismic activity. Consequently,

11

Table of Contents

state regulators implementing both the federal UIC program and state corollaries are heavily scrutinizing the location of injection facilities relative to faulting and are limiting both the density and injection facilities as well as the rate of injection.

In New Mexico, the New Mexico Oil Conservation Division (“NMOCD”) administers the UIC program for all injection wells that are related to oil and natural gas production. In Texas, the Texas Railroad Commission (“RRC”) regulates the disposal of produced water by injection well. Permits must be obtained before drilling saltwater disposal wells, and casing integrity monitoring must be conducted periodically to ensure the casing is not leaking salt water to groundwater. Contamination of groundwater by oil and natural gas drilling, production, and related operations may result in fines, penalties, and remediation costs, among other sanctions and liabilities under the SDWA and state laws. In response to recent seismic events near underground injection wells used for the disposal of oil and natural gas-related waste waters, federal and some state agencies have begun investigating whether such wells have caused increased seismic activity, and some states have shut down or placed volumetric injection limits on existing wells or imposed moratoria on the use of such injection wells. In response to concerns related to induced seismicity, regulators in some states have already adopted or are considering additional requirements related to seismic safety. For example, the RRC has adopted rules for injection wells to address these seismic activity concerns in Texas. Among other things, the rules require companies seeking permits for disposal wells to provide seismic activity data in permit applications, provide for more frequent monitoring and reporting for certain wells and allow the RRC to modify, suspend, or terminate permits on grounds that a disposal well is likely to be, or determined to be, causing seismic activity. In 2021, the NMOCD announced a new plan for responding to increased seismic activity in the Permian Basin. Under the new plan, pending permits for wastewater injection in certain areas will be subject to additional reporting and monitoring requirements. More stringent regulation of injection wells could lead to reduced construction or the capacity of such wells, which could in turn impact the availability of injection wells for disposal of wastewater from our operations. Increased costs associated with the transportation and disposal of produced water, including the cost of complying with regulations concerning produced water disposal, may reduce our profitability. The costs associated with the disposal of proposed water are commonly incurred by all oil and natural gas producers, however, and we do not believe that these costs will have a material adverse effect on our operations. In addition, third-party claims may be filed by landowners and other parties claiming damages for alternative water supplies, property damages, and bodily injury.

Hydraulic Fracturing

Hydraulic fracturing is a practice in the oil and natural gas industry used to stimulate production of natural gas and/or oil from low permeability subsurface rock formations by injecting water, sand and chemicals under pressure. Oil and natural gas may be recovered from certain of our oil and natural gas properties through the use of hydraulic fracturing. Hydraulic fracturing is subject to regulation by state regulatory authorities, and several federal agencies have asserted federal regulatory authority over certain aspects of the hydraulic fracturing process. For example, the EPA published permitting guidance in February 2014 addressing the use of diesel fuel in fracturing operations, and in June 2016 EPA issued final effluent limitations guidelines under the CWA that waste-water from shale natural gas extraction operations must meet before discharging to a publicly owned treatment works. The EPA also issued an Advance Notice of Proposed Rulemaking under the Toxic Substances Control Act (“TSCA”) in 2014 regarding reporting of the chemical substances and mixtures used in hydraulic fracturing but, to date, has taken no further action. Separately, the BLM published a final rule in March 2015 that establishes new or more stringent standards for performing hydraulic fracturing on federal and Indian lands. However, a Wyoming federal court struck down this rule in June 2016. The June 2016 decision was appealed by the BLM to the U.S. Circuit Court of Appeals for the Tenth Circuit. However, following issuance of a presidential executive order to review rules related to the energy industry, in July 2017, the BLM published a notice of proposed rulemaking to rescind the 2015 final rule. In September 2017, the Tenth Circuit issued a ruling to vacate the Wyoming trial court decision and dismiss the lawsuit challenging the 2015 rule in light of the BLM’s proposed rulemaking. The BLM issued a final rule repealing the 2015 hydraulic fracturing rule in December 2017. The current administration has announced that it intends to review the repeal of the 2015 hydraulic fracturing rule under the Executive Order on Protecting Public Health and the Environment and Restoring Science to Tackle the Climate Crisis.

Congress has from time to time considered legislation to provide for federal regulation of hydraulic fracturing and to require disclosure of the chemicals used in the hydraulic fracturing process but, at this time, federal legislation related to hydraulic fracturing appears uncertain. In Texas and New Mexico, specific oil and natural gas regulations apply to oil and gas operations, including the drilling, completion and operations of wells, and the disposal of waste oil and salt water. There are also procedures incident to the plugging and abandonment of dry holes or other non-operational wells, all as governed by the applicable governing state agency. As an example, the RRC adopted rules in 2014 requiring companies seeking permits for disposal wells to provide seismic activity data in permit applications. The rules also allow the RRC to modify, suspend, or terminate permits if a disposal well is determined to be causing seismic activity. Determinations by the RRC under these rules may adversely affect our operations. In New Mexico, the Produced Water Act, effective July 1, 2019, governs the discharge, handling, transport, storage, and recycling or treatment of produced water.

12

Table of Contents

Additionally, New Mexico has adopted regulations that require the disclosure of information regarding the substances used in the hydraulic fracturing process. In January 2021, State Senator Antoinette Sedillo Lopez of New Mexico, introduced a bill which would prohibit certain uses of fresh water in fracking operations, require the disclosure of the chemical composition of produced water from spills, and increase penalties for produced water spills by the oil and gas industry. State Senator Sedillo introduced another bill for the 2021 legislative session seeking to prevent the New Mexico Energy, Minerals and Natural Resources Department from issuing new fracking permits until 2025. Similar legislation was unsuccessful in the 2019 and 2020 legislative sessions. However, if enacted, this legislation would have a material adverse effect on our business and prospects.

Local governments may also seek to adopt ordinances within their jurisdictions regulating the time, place and manner of drilling activities in general or hydraulic fracturing activities in particular. In Texas, however, local governments are expressly preempted from regulating oil and gas operations with limited exceptions, under Texas Natural Resources Code Section 81.0523. If new laws or regulations that significantly restrict hydraulic fracturing are adopted at the local, state, or federal level, our fracturing activities could become subject to additional permit and financial assurance requirements, more stringent construction requirements, increased reporting or plugging and abandoning requirements or operational restrictions and associated permitting delays and potential increases in costs. These delays or additional costs could adversely affect the determination of whether a well is commercially viable and could cause us to incur substantial compliance costs. Restrictions on hydraulic fracturing could also reduce the amount of oil and natural gas that we are ultimately able to produce in commercial quantities.

Climate Change

Continuing political and social attention to the issue of global climate change has resulted in both existing and pending international agreements and national, regional or local legislation and regulatory measures to limit or reduce emissions of so-called greenhouse gases (“GHGs”), such as cap and trade regimes, carbon taxes, restrictive permitting, increased fuel efficiency standards and incentives or mandates for renewable energy. In December 2009, the EPA published an endangerment finding concluding that emissions of CO2, methane and certain other GHGs present an endangerment to public health and the environment because emissions of such gases are, according to the EPA, contributing to warming of the earth’s atmosphere and other climatic changes. Based on its findings, the EPA has adopted and implemented regulations under existing provisions of the CAA that, among other things, establish Prevention of Significant Deterioration (“PSD”) construction and Title V operating permit requirements for GHG emissions from certain large stationary sources that already are major sources of criteria pollutants under the CAA. Facilities required to obtain PSD permits for their GHG emissions also will be required to meet “best available control technology” standards that typically are GHG emissions could adversely affect our operations and restrict or delay our ability to obtain air permits for new or modified facilities that exceed GHG emission thresholds. In addition, the EPA has adopted rules requiring the reporting of GHG emissions from oil and natural gas production and processing facilities on an annual basis, as well as reporting GHG emissions from gathering and boosting systems, oil well completions and workovers using hydraulic fracturing.

In June 2016, the EPA finalized rules to reduce methane emissions from new, modified or reconstructed sources in the oil and natural gas sector, including implementation of a leak detection and repair (“LDAR”) program to minimize methane emissions, under the CAA’s New Source Performance Standards in 40 C.F.R. Part 60, Subpart OOOOa (“GHG NSPS”). On April 18, 2017, the EPA announced its intention to reconsider certain aspects of those regulations, and in June 2017, the EPA proposed a two-year stay of certain requirements of the GHG NSPS regulations. In October 2018 the EPA proposed revisions to the GHG NSPS, such as changes to the frequency for monitoring fugitive emissions at well sites and changes to requirements that a professional engineer certify when meeting certain GHG NSPS requirements is technically infeasible. EPA proposed further revisions to the GHG NSPS on September 24, 2019, including rescinding the methane requirements in the GHG NSPS that apply to sources in the production and processing segments of the industry. In September 2020, the EPA finalized amendments to the GHG NSPS that rescind requirements for the transmission and storage segment of the oil and natural gas industry and rescind methane-specific limits that apply to the industry’s production and processing segments, among other things. The current administration has announced that it intends to review the September 2020 rules under the Executive Order on Protecting Public Health and the Environment and Restoring Science to Tackle the Climate Crisis, which review may result in the reinstatement of the now-rescinded standards or promulgation of more stringent standards. Our Company has taken measures to control methane leaks, but it is possible that these rules and future revisions thereto will require us to take further methane emission reduction measures, which may require us to expend material sums.

In addition, in November 2016, the U.S. Department of the Interior Bureau of Land Management (“BLM”) issued final rules to reduce methane emissions from venting, flaring, and leaks during oil and natural gas operations on federal lands that are substantially similar to the GHG NSPS requirements. However, in December 2017, the BLM published a final rule to temporarily suspend or delay

13

Table of Contents

certain requirements contained in the November 2016 final rule until January 17, 2019, including those requirements relating to venting, flaring and leakage from oil and gas production activities. Further, in September 2018, the BLM published a final rule revising or rescinding certain provisions of the 2016 rule, which became effective on November 27, 2018. Both the 2016 and the 2018 rule were challenged in federal court. On July 21, 2020, a Wyoming federal court vacated almost all of the 2016 rule, including all provisions relating to the loss of gas through venting, flaring, and leaks, and on July 15, 2020, a California federal court vacated the 2018 rule. As a result of these decisions, the 1979 regulations concerning venting, flaring and lost production on federal land have been reinstated. The current administration is likely to impose new regulations on GHG emissions from oil and natural gas production operations on federal land, given the long-term trend towards increasing regulation in this area. Moreover, several states have already adopted rules requiring operators of both new and existing sources to develop and implement an LDAR program and to install devices on certain equipment to capture methane emissions. Compliance with these rules could require us to purchase pollution control and leak detection equipment, and to hire additional personnel to assist with inspection and reporting requirements.

Additionally, a number of state and regional efforts are aimed at tracking and/or reducing GHG emissions by means of cap-and-trade programs that typically require major sources of GHG emissions to acquire and surrender emission allowances in return for emitting those GHGs. On an international level, the United States is one of almost 200 nations that agreed in December 2015 to an international climate change agreement in Paris, France that calls for countries to set their own GHG emissions targets and be transparent about the measure each country will use to achieve its GHG emissions targets, (the “Paris Agreement”). However, the Paris Agreement does not impose any binding obligations on the United States. In June 2017, President Trump announced that the United States would withdraw from the Paris Agreement, which became effective November 4, 2020. President Biden announced on January 20, 2021 that the United States will rejoin the Paris Agreement. In November 2021, the United States participated in the United Nations Climate Change Conference in Glasgow, Scotland, United Kingdom (“COP26”). COP26 resulted in a pact among approximately 200 countries, including the United States, called the Glasgow Climate Pact. Relatedly, the United States and European Union jointly announced the launch of the “Global Methane Pledge,” which aims to cut global methane pollution at least 30% by 2030 relative to 2020 levels, including “all feasible reductions” in the energy sector. In conjunction with COP26, the United States committed to an economy-wide target of reducing net greenhouse gas emissions by 50-52 percent below 2005 levels by 2030. Also in November 2021, President Biden signed a $1 trillion dollar infrastructure bill into law. The new infrastructure law includes several climate-focused investments, including upgrades to power grids to accommodate increased use of renewable energy and expansion of electric vehicle infrastructure. Further, several states, including New Mexico, and local governments remain committed to the principles of the Paris Agreement in their effectuation of policy and regulations. Although it is not possible at this time to predict what additional domestic legislation may be adopted in light of the Paris Agreement or the Glasgow Climate Pact, or how legislation or new regulations that may be adopted based on the Paris Agreement or the Glasgow Climate Pact to address GHG emissions would impact our business, any such future laws and regulations imposing reporting obligations on, or limiting emissions of GHGs from, our equipment and operations could require us to incur costs to reduce emissions of GHGs associated with our operations and could decrease demand for oil and natural gas.

The adoption and implementation of any laws or regulations imposing reporting obligations on, or limiting emissions of GHG from, our equipment and operations could require additional expenditures to reduce emissions of GHGs associated with its operations or could adversely affect demand for the oil and natural gas we produce, and thus possibly have a material adverse effect on our revenues, as well as having the potential effect of lowering the value of our reserves. Recently, stakeholders concerned about the potential effects of climate change have directed their attention at sources of funding for fossil-fuel energy companies, which has resulted in certain financial institutions, funds and other sources of capital restricting or eliminating their investment in oil and natural gas activities. Ultimately, this could make it more difficult to secure funding for exploration and production activities. Finally, to the extent increasing concentrations of GHGs in the Earth’s atmosphere may produce climate changes that have significant physical effects, such as increased frequency and severity of storms, droughts, floods and other climatic events, such events could have a material adverse effect on the Company and potentially subject the Company to further regulation. The trend of more expansive and stringent environmental legislation and regulations, including greenhouse gas regulation, could continue, resulting in increased costs of conducting business and consequently affecting our profitability. We also are aware that the SEC intends to propose new and additional rules regarding company disclosure of climate change risk. We will monitor and comply with any such promulgated rules.

14

Table of Contents

Threatened and endangered species, migratory birds and natural resources

Various federal and state statutes prohibit certain actions that adversely affect endangered or threatened species and their habitat, migratory birds, wetlands, and natural resources. These statutes include the Endangered Species Act (“ESA”), the Migratory Bird Treaty Act (“MBTA”) and the Clean Water Act. The U.S. Fish and Wildlife Service (“FWS”) may designate critical habitat areas that it believes are necessary for survival of threatened or endangered species. As a result of a 2011 settlement agreement, the FWS was required to determine whether to identify more than 250 species as endangered or threatened under the ESA by no later than completion of the agency’s 2017 fiscal year. The FWS missed the deadline but reportedly continues to review new species for protected status under the ESA pursuant to the settlement agreement. A critical habitat designation could result in further material restrictions on federal land use or on private land use and could delay or prohibit land access or development. Where takings of or harm to species or damages to wetlands, habitat, or natural resources occur or may occur, government entities or at times private parties may act to prevent or restrict oil and natural gas exploration activities or seek damages for any injury, whether resulting from drilling or construction or releases of oil, wastes, hazardous substances or other regulated materials, and in some cases, criminal penalties may result. Similar protections are offered to migratory birds under the MBTA. Recently, there have been renewed calls to review protections currently in place for the dunes sagebrush lizard, whose habitat includes portions of the Permian Basin, and to reconsider listing the species under the ESA. While some of our operations may be located in areas that are designated as habitats for endangered or threatened species or that may attract migratory birds, we believe that we are in substantial compliance with the ESA and the MBTA, and we are not aware of any proposed ESA listings that will materially affect our operations. Nevertheless, we are monitoring proposed listings by the FWS, such as the January 2022 proposal to list the Sacramento Mountains checkerspot butterfly in New Mexico, to ensure continued compliance. The federal government in the past has issued indictments under the MBTA to several oil and natural gas companies after dead migratory birds were found near reserve pits associated with drilling activities. In January 2020, a new DOI rule went into effect clarifying that only the intentional taking of protected migratory birds is subject to prosecution under the MTBA. In December 2021, however, that rule was revoked, and a new rule took effect reinstating the prohibition on incidental takes under the MTBA. The identification or designation of previously unprotected species as threatened or endangered in areas where underlying property operations are conducted could cause us to incur increased costs arising from species protection measures or could result in limitations on our development activities that could have an adverse impact on our ability to develop and produce our oil and natural gas reserves. If we were to have a portion of our leases designated as critical or suitable habitat, it could adversely impact the value of our leases.

Operational Hazards and Insurance

The oil and natural gas business involves a variety of operating risks, including the risk of fire, explosions, well blow-outs, pipe failures, industrial accidents, and, in some cases, abnormally high pressure formations which could lead to environmental hazards such as oil releases, chemical releases, natural gas leaks and the discharge of toxic gases.

Any of these risks could adversely affect our ability to conduct operations or result in substantial losses to us, for example, as a result of damage to our property or equipment or injury to our personnel. These operational risks could also result in the spill or release of hazardous materials such as drilling fluids or other chemicals, which may result in pollution, natural resource damages, or other environmental damage and necessitate investigation and remediation costs. As a result, we could be subject to liability under environmental law or common law theories. In addition, these operational risks could result in the suspension or delay of our operations, which could have significant adverse consequences on our business.

In accordance with what we believe to be industry practice, we maintain insurance against some, but not all, of the operating risks to which our business is exposed. Under certain circumstances, we may be liable for environmental damage caused by previous owners or operators of properties that we own, lease or operate. As a result, we may incur substantial liabilities to third parties or governmental entities for environmental matters for which we do not have insurance coverage, which could reduce or eliminate funds available for exploration, development or acquisitions or cause us to incur losses.

Human Capital Management

Key to our mission is our employees upon which the foundation of our company is built.  We seek to employ highly trained people who exemplify our core values of honesty and integrity, and are diligent, hard-working individuals who deliver results, and who are good neighbors and contribute to the communities in which they live.

15

Table of Contents

As of December 31, 2021, we had 53 full-time employees.  Our employees are extremely valuable to the success of the Company, and we encourage their collaboration and respect their diverse points of view and opinions.  In addition to our full-time employees, the Company also employs a diverse group of independent contractors who assist our full-time staff in a range of areas including geology, engineering, land, accounting, and field operations, as needed.  None are represented by labor unions or covered by any collective bargaining agreements.

Diversity and inclusion: The unique backgrounds and experiences of our employees help to develop a wide range of perspectives that lead to better solutions. Our staff’s diversity is reflected in our full-time employees where 26% are women and approximately one third represent minorities. The majority of our employees are citizens of the United States, with a few retaining dual citizenships in other countries. The employees who are not US citizens, are legally registered to live and work here and the Company is committed to helping those employees retain their ability to remain in the US and continue their employment. The Company is also committed to continuously providing an inclusive work environment where all of our employees can be respected, valued, and successful in achieving their goals, all while contributing to the Company’s success.

We recognize that attracting, retaining and developing our employees is critical for our future success. Our Executive Vice President of Land, Legal, Human Resources and Marketing, together with our Chief Executive Officer are responsible for developing and executing our human capital strategy, with oversight by the Board of Directors and the Board committees. Some of our key human capital areas of focus include:

Building a Safe Workforce Starts with Our Culture: Ring is committed to building a safety culture that empowers employees and contractors to act as needed to work safely and to stop the job, without retribution, if conditions are deemed unsafe. We strive to be incident-free every day across our operations. We are focused on building and maintaining a safe workplace for all employees and contractors. The oil and gas industry has a number of inherent risks and our workers are often outdoors, in all seasons and all types of weather. In addition, our field personnel spend significant time driving on a daily basis, putting them at risk for driving incidents. A strong safety culture is essential to the Company’s success, and we emphasize the important role that all personnel play in creating and maintaining a safe work environment.

Health and Safety Training and Education: We offer a wide range of training opportunities for employees and contractors to help them develop their skills and understanding of our health and safety policy and programs. In addition to teaching specific skills, these training opportunities encourage personal responsibility for safe operating conditions and help to build a culture of individual accountability for conducting job tasks in a safe and responsible manner.

Ring Energy supports both company identified and employee identified educational opportunities for employees to advance in their technical and managerial skills and to help provide opportunities to advance throughout our company. Ring’s support comes in the form of full or partial funding of educational programs and opportunities, including time off work to attend and/or prepare for such programs.

COVID-19 Response: Our COVID-19 management plan was built around the need to support all employees in managing their personal and professional challenges. Frequent and transparent communications are the focus at every level of the organization from those on the front lines to those in our corporate offices. During the early stages of the pandemic, Ring’s management team directed the Company’s overall COVID-19 pandemic response by implementing all relevant county, state and local government guidelines, directives and regulations, and developed and adopted work-from-home provisions and procedures, implemented safe working protocols for production teams, assessed and implemented appropriate return-to-office protocols, and provided timely and transparent communications to employees and key stakeholders.

In response to the COVID-19 pandemic, Ring began providing the following benefits to its employees:

covering the cost of COVID-19 testing through expanded insurance coverage;
promoting telehealth benefits;
promoting mental health and well-being plans; and
providing additional paid sick leave for quarantined employees.

16

Table of Contents

Seasonal Nature of Business

Generally, the demand for oil and natural gas fluctuates depending on the time of year. Seasonal anomalies such as mild winters and summers may sometimes lessen this fluctuation. Further, pipelines, utilities, local distribution companies, and industrial end users utilize oil and natural gas storage facilities and purchase some of their anticipated winter requirements during the summer, which can also lessen seasonal demand.

Available Information

Our website can be found at www.ringenergy.com. Our annual reports on Form 10-K, quarterly reports on Form 10-Q, current reports on Form 8-K and amendments to those reports filed pursuant to Section 13(a) or 15(d) of the Exchange Act of 1934 will be available through our website free of charge as soon as reasonably practical after we electronically file such material with, or furnish it to, the SEC. The information on, or that can be accessed through, our website is not incorporated by reference into this Annual Report and should not be considered part of this Annual Report. The SEC also maintains a website (http://www.sec.gov) that contains reports, proxy and information statements and other information regarding issuers that file electronically with the SEC.

Item 1A:Risk Factors

Our business is subject to various risks and uncertainties in the ordinary course of business. The following summarizes significant risks and uncertainties that may adversely affect our business, financial condition, or results of operations. We cannot assure you that any of the events discussed in the risk factors below will not occur. Further, the risks and uncertainties described below are not the only ones we face. Additional risks not presently known to us or that we currently deem immaterial may also materially affect our business. Readers should carefully consider the risk factors included below as well as those matters referenced in this report under “Forward-Looking Statements” and other information included and incorporated by reference into this report.

Risks Relating to Our Business, Operations and Strategy

Part of our strategy involves using some of the latest available horizontal drilling and completion techniques, which involve additional risks and uncertainties in their application as compared to conventional drilling.

Our operations utilize some of the latest horizontal drilling and completion techniques as developed by us, other oil and natural gas exploration and production companies and our service providers. The additional risks that we face while drilling horizontally include, but are not limited to, the following:

drilling wells that are significantly longer and/or deeper than conventional wells;
landing our wellbore in the desired drilling zone;
staying in the desired drilling zone while drilling horizontally through the formation;
running our casing the entire length of the wellbore; and
being able to run tools and other equipment consistently through the horizontal wellbore.

Risks that we face while completing our wells include, but are not limited to, the following:

the ability to fracture or stimulate the planned number of stages in a horizontal or lateral wellbore;
the ability to run tools the entire length of the wellbore during completion operations; and
the ability to successfully clean out the wellbore after completion of the final fracture stimulation stage.

17

Table of Contents

If our assessments of purchased properties are materially inaccurate, it could have a significant impact on future operations and earnings.

The successful acquisition of producing properties requires assessments of many factors, which are inherently inexact and may be inaccurate, including the following:

unforeseen title issues;
the amount of recoverable reserves;
future oil and natural gas prices;
estimates of operating costs;
estimates of future development costs;
estimates of the costs and timing of plugging and abandonment; and
potential environmental and other liabilities.

Our assessment will not reveal all existing or potential problems, nor will it permit us to become familiar enough with the properties to assess fully their capabilities and deficiencies. We plan to undertake further development of our properties through the use of cash flow from existing production. Therefore, a material deviation in our assessments of these factors could result in less cash flow being available for such purposes than we presently anticipate, which could either delay future development operations (and delay the anticipated conversion of reserves into cash) or cause us to seek alternative sources to finance development activities.

Prospects that we decide to drill may not yield oil or natural gas in commercially viable quantities.

Our prospects are in various stages of evaluation, ranging from prospects that are currently being drilled to prospects that will require substantial additional seismic data processing and interpretation. There is no way to predict in advance of drilling and testing whether any particular prospect will yield oil or natural gas in sufficient quantities to recover drilling or completion costs or to be economically viable. This risk may be enhanced in our situation, due to the fact that a significant percentage (44)% of our proved reserves is currently proved undeveloped reserves. The use of seismic data and other technologies and the study of producing fields in the same area will not enable us to know conclusively prior to drilling whether oil or natural gas will be present or, if present, whether oil or natural gas will be present in commercial quantities. We cannot assure you that the analogies we draw from available data obtained by analyzing other wells, more fully explored prospects or producing fields will be applicable to our drilling prospects.

A substantial percentage of our proved properties are undeveloped; therefore, the risk associated with our success is greater than would be the case if the majority of our properties were categorized as proved developed.

Because a substantial percentage of our proved properties are proved undeveloped (44)%, we will require significant additional capital to develop such properties before they may become productive. Further, because of the inherent uncertainties associated with drilling for oil and gas, some of these properties may never be developed to the extent that they result in positive cash flow. Even if we are successful in our development efforts, it could take several years for a significant portion of our undeveloped properties to be converted to positive cash flow.

While our current business plan is to fund the development costs with cash flow from our other producing properties, if such cash flow is not sufficient, we may be forced to seek alternative sources for cash, through the issuance of additional equity or debt securities, increased borrowings or other means.

18

Table of Contents

Hedging transactions may limit our potential gains.

To reduce our exposure to commodity price uncertainty and increase cash flow predictability relating to the marketing of our crude oil and natural gas, we have entered into crude oil and natural gas price hedging arrangements with respect to a portion of our expected production in order to economically hedge a portion of our forecasted oil and natural gas production. Additionally, our credit facility requires us to hedge a portion of our production. In addition, these derivative contracts may limit the benefit we would otherwise receive from increases in the prices for oil and natural gas.  As of December 31, 2021, the Company has in place derivative contracts covering 3,129 barrels of oil per day for the calendar year 2022.  All of the 3,129 barrels of oil in 2022 are in the form of swaps of WTI Crude Oil prices.  The oil swap prices for 2022 range from $44.22 to $50.05, with a weighted average swap price of $46.60.

Hedging transactions may expose us to risk of financial loss.

While intended to reduce the effects of volatile crude oil and natural gas prices, such derivative contracts expose us to risk of financial loss in some circumstances, including when there is a change in the expected differential between the underlying price in the hedging agreement and actual prices received, or when the counterparty to the derivative contract is financially constrained and defaults on its contractual obligations. It is also possible that sales volumes fall below the hedged volumes leaving a portion of our position uncovered.

The transition from LIBOR to alternative reference “benchmark” interest rates is uncertain and could adversely affect the value of or the interest rates on our investments and obligations indexed to LIBOR, as well as the revenue and expenses associated with those assets and obligations.

LIBOR is an interest rate benchmark that has been widely used in financial contracts around the world for decades. In July 2017, the United Kingdom’s Financial Conduct Authority (“FCA”), which regulates the London Interbank Offered Rate (“LIBOR”) announced that it intended to phase out LIBOR by the end of 2021. Following discussions with the FCA and other official sector bodies, the Intercontinental Exchange Benchmark Administration announced in March 2021 the publication of certain USD LIBOR settings will continue through June 30, 2023. The Alternative Reference Rates Committee of the Federal Reserve Board (ARRC), a group of market participants convened to help ensure a successful transition away from LIBOR, has recommended the Secured Overnight Financing Rate (SOFR) as its preferred alternative reference rate and has proposed a transition plan and timeline designed to encourage the adoption of SOFR from LIBOR.

We are in the process of analyzing and identifying our population of securities, financial instruments and contracts that utilize LIBOR (collectively “LIBOR Instruments”) to determine if we have any material exposure to the transition from LIBOR. To the extent we hold LIBOR Instruments, the terms of these instruments may have fallback provisions that provide for an alternative reference rate when LIBOR ceases to exist. For securities without adequate fallback provisions already in place, legislation governing securities under New York law has been enacted to provide a safe harbor for transition to the recommended alternative reference rate. In addition, federal legislation has been introduced to provide the same protection for securities not governed by New York law.

Notwithstanding, in preparation for the phase out of LIBOR, we may need to renegotiate our LIBOR Instruments that utilize

LIBOR. However, these efforts may not be successful in mitigating the legal and financial risk from changing the reference rate in our LIBOR Instruments. Furthermore, the discontinuation of LIBOR may adversely impact our ability to manage and hedge exposures to fluctuations in interest rates using derivative instruments.

As a result, the transition of our LIBOR Instruments to alternative reference rates may result in adverse changes to the net investment income, fair market value and return on those investments. We intend to continue to evaluate and monitor the risks associated with the LIBOR transition which include identifying and monitoring our exposure to LIBOR, monitoring the market adoption of alternative reference rates and ensuring operational processes are updated to accommodate alternative rates. Due to uncertainty surrounding alternative rates, we are unable to predict the overall impact of this change at this time.

19

Table of Contents

We may be adversely affected by natural disasters, pandemics (including the recent coronavirus outbreak) and other catastrophic events, and by man-made problems such as terrorism, that could disrupt our business operations.

Natural disasters, adverse weather conditions, floods, pandemics (including the recent coronavirus outbreak), acts of terrorism and other catastrophic or geo-political events may cause damage or disruption to our operations and the global economy, or could result in market disruption, any of which could have an adverse effect on our business, operating results, and financial condition.

The ongoing coronavirus outbreak has impacted various businesses throughout the world, including an impact on the global demand for oil and natural gas, travel restrictions and the extended shutdown of certain businesses in impacted geographic regions. If the coronavirus outbreak situation should worsen, it could have a material adverse impact on our business operations, operating results and financial condition.

The ongoing COVID-19 pandemic, and the relations of and agreements between OPEC+ producers, could disrupt our operations and adversely impact our business and financial results.

The COVID-19 pandemic has led to worldwide shutdowns, reductions in commercial and interpersonal activity, and changes in consumer behavior. In attempting to control the spread of COVID-19, governments around the world-imposed regulations such as shelter-in-place orders, quarantines, executive orders and similar restrictions. As a result, the global economy has been marked by significant slowdown and uncertainty, which has in the past led to a precipitous decline in oil prices in response to decreased demand. We currently are unable to predict the duration or severity of the spread of COVID-19 or the adverse effects thereof.

The loss of key members of management or failure to attract and retain other highly qualified personnel could, in the future, affect the Company’s business results.

The Company’s success depends on its ability to attract, retain and motivate a highly-skilled and diverse management team and workforce. During the latter half of 2020, the Company experienced significant leadership changes, including appointing a new Chief Executive Officer, Executive Vice President of Operations, a new Executive Vice President of Engineering and Corporate Strategy, a new Vice President of Compliance, a new Executive Vice President of Land, Legal, Human Resources and Marketing along with the appointment of new directors to the Board of Directors. In the first quarter of 2021, the Company appointed a new Chief Financial Officer. Executive leadership transitions can be difficult to manage and could cause disruption to our business. Failure to ensure that the Company has the depth and breadth of management and personnel with the necessary skill set and experience could impede its ability to achieve growth objectives and execute its operational strategy. As the Company continues to expand, it will need to promote or hire additional staff, and, as a result of increased compensation and benefit mandates, it may be difficult to attract or retain such individuals without incurring significant additional costs.

Risks Relating to the Oil and Natural Gas Industry

A substantial or extended decline in oil and natural gas prices may adversely affect our business, financial condition or results of operations and our ability to meet our capital expenditure obligations and financial commitments.

The price we receive for our oil and natural gas production heavily influences our revenue, profitability, access to capital and future rate of growth. Oil and natural gas are commodities and, therefore, their prices are subject to wide fluctuations in response to relatively minor changes in supply and demand. Historically, the markets for oil and natural gas have been volatile. These markets will likely continue to be volatile in the future. The prices we receive for our production, and the levels of our production, depend on numerous factors beyond our control. These factors include, but are not limited to, the following:

changes in global supply and demand for oil and natural gas;
the actions of the Organization of Petroleum Exporting Countries, or OPEC;
the actions of oil exporting countries that are not members of OPEC;
the price and quantity of imports of foreign oil and natural gas;

20

Table of Contents

political conditions, including embargoes, in or affecting other oil-producing activity;
acts of war and related armed conflicts;
the level of global oil and natural gas exploration and production activity;
the level of global oil and natural gas inventories;
weather conditions;
technological advances affecting energy consumption; and
the price and availability of alternative fuels.

Lower oil and natural gas prices may not only decrease our revenues on a per BOE basis but also may reduce the amount of oil and natural gas that we can produce economically. Lower prices also negatively impact the value of our proved reserves. A substantial or extended decline in oil or natural gas prices may materially and adversely affect our future business, financial condition, results of operations, liquidity or ability to finance planned capital expenditures.

Drilling for and producing oil and natural gas are high risk activities with many uncertainties that could adversely affect our business, financial condition or results of operations.

Our future success will depend on our exploitation, exploration, development and production activities. Our oil and natural gas exploration and production activities are subject to numerous risks beyond our control, including the risk that drilling will not result in commercially viable oil or natural gas production. For example, in January 2021, President Biden signed an Executive Order directing the Department of Interior (the “DOI”) to temporarily pause new oil and gas leases on federal lands and waters pending completion of a comprehensive review of the federal government’s existing oil and gas leasing and permitting program. In June 2021, a federal district court enjoined the DOI from implementing the pause and leasing resumed, although litigation over the leasing pause remains ongoing. In February 2022, another judge ruled that the Biden Administration’s efforts to raise the cost of climate change in its environmental assessments, would increase energy costs and damage state revenues from energy production. This ruling has cause federal agencies to delay issuing new oil and gas leases and permits on federal lands and waters. While we do not have a significant federal lands acreage position (240 net acres as of December 31, 2021), these actions could have a material adverse effect on our industry and the Company.

Our decisions to purchase, explore, develop or otherwise exploit prospects or properties will depend in part on the evaluation of data obtained through geophysical and geological analyses, production data and engineering studies, the results of which are often inconclusive or subject to varying interpretations. Please read “—Reserve estimates depend on many assumptions that may turn out to be inaccurate. . .” (below) for a discussion of the uncertainty involved in these processes. Our cost of drilling, completing and operating wells is often uncertain before drilling commences. Overruns in budgeted expenditures are common risks that can make a particular well or project uneconomical. Further, many factors may curtail, delay or cancel drilling, including delays imposed by or resulting from compliance with regulatory requirements; pressure or irregularities in geological formations; shortages of or delays in obtaining equipment and qualified personnel; equipment failures or accidents; adverse weather conditions; reductions in oil and natural gas prices; title problems; and limitations in the market for oil and natural gas.

Decreases in oil and natural gas prices may require us to take write-downs of the carrying values of our oil and natural gas properties which could negatively impact the trading value of our common stock.

Accounting rules require that we review periodically the carrying value of our oil and natural gas properties for possible impairment. Based on specific market factors and circumstances at the time of prospective impairment reviews, and the continuing evaluation of development plans, production data, economics and other factors, we may be required to write-down the carrying value of our oil and natural gas properties. A write-down would likely constitute a non-cash charge to earnings. The cumulative effect of a write-down could also negatively impact the trading price of our common stock.

21

Table of Contents

We follow the full cost method of accounting for our oil and natural gas properties. Under the full cost method, the net book value of properties, less related deferred income taxes, may not exceed a calculated “ceiling.” The ceiling is the estimated after tax future net revenues from proved oil and natural gas properties, discounted at 10% per year. Discounted future net revenues are estimated using oil and natural gas spot prices based on the average price during the preceding 12-month period determined as an un-weighted, arithmetic average of the first-day-of-the-month price for each month within such period, except for changes which are fixed and determinable by existing contracts. The net book value is compared to the ceiling on a quarterly basis. The excess, if any, of the net book value above the ceiling is required to be written off as an impairment expense. During the year ended December 31, 2020, we recorded a non-cash write-down of $277.5 million. During the years ended December 31, 2021, and 2019, we did not incur a write-down. Under SEC full cost accounting rules, any write-off recorded may not be reversed even if higher oil and natural gas prices increase the ceiling applicable to future periods. Future price decreases could result in reductions in the carrying value of such assets and an equivalent charge to earnings.

It is difficult to predict with reasonable certainty the amount of any future impairments given the many factors impacting the ceiling test calculation including, but not limited to, future pricing, operating costs, upward or downward reserve revisions, reserve adds, and tax attributes.

Decreases in oil and natural gas prices may affect our borrowing base, potentially requiring earlier than anticipated debt repayment, which could negatively impact the trading value of our common stock.

Decreases in oil and natural gas prices could also result in reductions in the borrowing base of our Credit Facility, thus requiring earlier than anticipated repayment of debt or possible default under our Credit Facility in the event we are unable to make payments under the Credit Facility on a timely basis.

Reserve estimates depend on many assumptions that may turn out to be inaccurate. Any material inaccuracies in these reserve estimates or underlying assumptions will materially affect the quantities and present value of our reserves.

The process of estimating oil and natural gas reserves is complex. It requires interpretations of available technical data and many assumptions, including assumptions relating to economic factors. Any significant inaccuracies in these interpretations or assumptions could materially affect the estimated quantities and present value of our reported reserves.

In order to prepare our estimates, we must project production rates and timing of development expenditures. We must also analyze available geological, geophysical, production and engineering data. The extent, quality and reliability of this data can vary. The process also requires economic assumptions about matters such as oil and natural gas prices, drilling and operating expenses, capital expenditures, taxes and availability of funds. Therefore, estimates of oil and natural gas reserves are inherently imprecise.

Actual future production, oil and natural gas prices, revenues, taxes, development expenditures, operating expenses and quantities of recoverable oil and natural gas reserves most likely will vary from our estimates. Any significant variance could materially affect the estimated quantities and present value of our reported reserves. In addition, we may adjust estimates of proved reserves to reflect production history, results of exploration and development, prevailing oil and natural gas prices and other factors, many of which are beyond our control.

You should not assume that the present value of future net revenues from our reported proved reserves is the current market value of our estimated oil and natural gas reserves. In accordance with SEC requirements, we generally base the estimated discounted future net cash flows from our proved reserves on prices and costs on the date of the estimate. Actual future prices and costs may differ materially from those used in the present value estimate. If future values decline or costs increase it could negatively impact our ability to finance operations, and individual properties could cease being commercially viable, affecting our decision to continue operations on producing properties or to attempt to develop properties. All of these factors would have a negative impact on earnings and net income, and most likely the trading price of our common stock. These factors could also result in the acceleration of debt repayment and a reduction in our borrowing base under our credit facility.

22

Table of Contents

We may incur substantial losses and be subject to substantial liability claims as a result of our oil and natural gas operations.

We are not insured against all risks. Losses and liabilities arising from uninsured and underinsured events could materially and adversely affect our business, financial condition and results of operations. Our oil and natural gas exploration and production activities are subject to all of the operating risks associated with drilling for and producing oil and natural gas, including the possibility of:

environmental hazards, such as uncontrollable flows of oil, natural gas, brine, well fluids, toxic gas or other pollution into the environment, including groundwater and shoreline contamination;
abnormally pressured formations;
mechanical difficulties, such as stuck oil field drilling and service tools and casing collapse;
fires and explosions;
personal injuries and death; and
natural disasters.

Any of these risks could adversely affect our ability to conduct operations or result in substantial losses to our Company. We may elect not to obtain insurance if we believe that the cost of available insurance is excessive relative to the risks presented. In addition, pollution and environmental risks generally are not fully insurable. If a significant accident or other event occurs and is not fully covered by insurance, then it could materially and adversely affect us.

Unless we replace our oil and natural gas reserves, our reserves and production will decline as reserves are produced.

Unless we conduct successful development, exploitation and exploration activities or acquire properties containing proved reserves, our proved reserves will decline as those reserves are produced. Producing oil and natural gas reservoirs generally are characterized by declining production rates that vary depending upon reservoir characteristics and other factors. Our future oil and natural gas reserves and production, and, therefore, our cash flow and income, are highly dependent on our success in efficiently developing and exploiting our current reserves and economically finding or acquiring additional recoverable reserves. If we are unable to develop, exploit, find or acquire additional reserves to replace our current and future production, our cash flow and income will decline as production declines, until our existing properties would be incapable of sustaining commercial production.

Competition is intense in the oil and natural gas industry.

We operate in a highly competitive environment for acquiring properties and marketing oil and natural gas. Our competitors include multinational oil and natural gas companies, major oil and natural gas companies, independent oil and natural gas companies, individual producers, financial buyers as well as participants in other industries that supply energy and fuel to consumers. Many of our competitors have greater and more diverse resources than we do. Additionally, competition for acquisitions may significantly increase the cost of available properties. We compete for the personnel and equipment required to explore, develop and operate properties. Our competitors also may have established long-term strategic positions and relationships in areas in which we may seek to enter. Consequently, our competitors may be able to address these competitive factors more effectively than we can. If we are not successful in our competition for oil and natural gas reserves or in our marketing of production, then our financial condition and operation results may be adversely affected.

If our access to markets is restricted, it could negatively impact our production, our income and our ability to retain our leases.

Market conditions or the unavailability of satisfactory oil and natural gas transportation arrangements may hinder our access to oil and natural gas markets or delay our production. The availability of a ready market for our oil and natural gas production depends on a number of factors, including the demand for and supply of oil and natural gas and the proximity of reserves to pipelines and terminal facilities. Our ability to market our production depends in substantial part on the availability and capacity of gathering systems, pipelines

23

Table of Contents

and processing facilities owned and operated by third parties. Our failure to obtain such services on acceptable terms could materially harm our business.

Currently, the majority of our production is sold to marketers and other purchasers that have access to nearby pipeline facilities. However, as we further develop our properties, we may find production in areas with limited or no access to pipelines, thereby necessitating delivery by other means, such as trucking or requiring compression facilities. Such restrictions on our ability to sell our oil or natural gas could have several adverse effects, including higher transportation costs, fewer potential purchasers (thereby potentially resulting in a lower selling price) or, in the event we were unable to market and sustain production from a particular lease for an extended time, possibly causing us to lose a lease due to lack of production.

Many of our properties are in areas that may have been partially depleted or drained by offset wells and certain of our wells may be adversely affected by actions we or other operators may take when drilling, completing, or operating wells that we or they own.

Many of our properties are in reservoirs that may have already been partially depleted or drained by earlier offset drilling. The owners of leasehold interests adjoining any of our properties could take actions, such as drilling and completing additional wells, which could adversely affect our operations. When a new well is completed and produced, the pressure differential in the vicinity of the well causes the migration of reservoir fluids toward the new wellbore (and potentially away from existing wellbores). As a result, the drilling and production of these potential locations by us or other operators could cause depletion of our proved reserves and may inhibit our ability to further develop our proved reserves. In addition, completion operations and other activities conducted on adjacent or nearby wells by us or other operators could cause production from our wells to be shut in for indefinite periods of time, could result in increased lease operating expenses and could adversely affect the production and reserves from our wells after they re-commence production. We have no control over the operations or activities of offsetting operators.

Multi-well pad drilling may result in volatility in our operating results.

We utilize multi-well pad drilling where practical. Because wells drilled on a pad are not brought into production until all wells on the pad are drilled and completed and the drilling rig is moved from the location, multi-well pad drilling delays the commencement of production from a given pad, which may cause volatility in our operating results. In addition, problems affecting one pad could adversely affect production from all wells on such pad. As a result, multi-well pad drilling can cause delays in the scheduled commencement of production or interruptions in ongoing production.

Extreme weather conditions, which could become more frequent or severe due to climate change, could adversely affect our ability to conduct drilling, completion and production activities in the areas where we operate.

Our exploitation and development activities and equipment could be adversely affected by extreme weather conditions, such as hurricanes or freezing temperatures, which may cause a loss of production from temporary cessation of activity from regional power outages or lost or damaged facilities and equipment. Such extreme weather conditions could also impact access to our drilling and production facilities for routine operations, maintenance and repairs and the availability of and our access to, necessary third-party services, such as gathering, processing, compression and transportation services. These constraints and the resulting shortages or high costs could delay or temporarily halt our operations and materially increase our operation and capital costs, which could have a material adverse effect on our business, financial condition and results of operations.

Restrictions on drilling activities intended to protect certain species of wildlife may adversely affect our ability to conduct drilling activities in some of the areas where we operate.

Oil and natural gas operations in our operating areas can be adversely affected by seasonal or permanent restrictions on drilling activities designed to protect certain wildlife, such as those restrictions imposed under The Endangered Species Act. Seasonal restrictions may limit our ability to operate in protected areas and can intensify competition for drilling rigs, oilfield equipment, services, supplies and qualified personnel, which may lead to periodic shortages when drilling is allowed. These constraints and the resulting shortages or high costs could delay our operations and materially increase our operating and capital costs. Permanent restrictions imposed to protect endangered species could prohibit drilling in certain areas or require the implementation of expensive mitigation measures. The designation of previously unprotected species in areas where we operate as threatened or endangered could cause us to incur increased

24

Table of Contents

costs arising from species protection measures or could result in limitations on our exploration, development and production activities that could have an adverse impact on our ability to develop and produce our reserves.

Our operations are substantially dependent on the availability, use and disposal of water. New legislation and regulatory initiatives or restrictions relating to water disposal wells could have a material adverse effect on our future business, financial condition, operating results and prospects.

Water is an essential component of our drilling and hydraulic fracturing processes. If we are unable to obtain water to use in our operations from local sources, we may be unable to economically produce oil, natural gas and NGLs, which could have an adverse effect on our business, financial condition and results of operations. Wastewaters from our operations typically are disposed of via underground injection. Some studies have linked earthquakes in certain areas to underground injection, which is leading to greater public scrutiny of disposal wells. Any new environmental initiatives or regulations that restrict injection of fluids, including, but not limited to, produced water, drilling fluids and other wastes associated with the exploration, development or production of oil and gas, or that limit the withdrawal, storage or use of surface water or ground water necessary for hydraulic fracturing of our wells, could increase our operating costs and cause delays, interruptions or cessation of our operations, the extent of which cannot be predicted, and all of which would have an adverse effect on our business, financial condition, results of operations and cash flows.

Risks Relating to Legal, Regulatory, Privacy and Tax Matters

We are subject to complex laws that can affect the cost, manner or feasibility of doing business.

Exploration, development, production and sale of oil and natural gas are subject to extensive federal, state, local and international regulation. It is not possible to predict how or when regulations affecting our operations might change. In January 2021, President Biden signed an Executive Order directing the Department of Interior (the “DOI”) to temporarily pause new oil and gas leases on federal lands and waters pending completion of a comprehensive review of the federal government’s existing oil and gas leasing and permitting program. In June 2021, a federal district court enjoined the DOI from implementing the pause and leasing resumed, although litigation over the leasing pause remains ongoing. In February 2022, another judge ruled that the Biden Administration’s efforts to raise the cost of climate change in its environmental assessments, would increase energy costs and damage state revenues from energy production. This ruling has caused federal agencies to delay issuing new oil and gas leases and permits on federal lands and waters. Similarly, at the state level, New Mexico’s consideration of legislation to prohibit certain uses of freshwater in fracking operations, implement new disclosure requirements, and increase penalties may affect the cost and feasibility of our business. We may be required to make large expenditures to comply with governmental regulations. Other matters subject to regulation include:  discharge permits for drilling operations; drilling bonds; reports concerning operations; the spacing of wells; unitization and pooling of properties; and taxation.

Under these laws, we could be liable for personal injuries, property damage and other damages. Failure to comply with these laws also may result in the suspension or termination of our operations and subject us to administrative, civil and criminal penalties. Moreover, these laws could change in ways that substantially increase our costs. Any such liabilities, penalties, suspensions, terminations or regulatory changes could materially adversely affect our financial condition and results of operations.

Our operations may incur substantial liabilities to comply with the environmental laws and regulations.

Our oil and natural gas operations are subject to stringent federal, state and local laws and regulations relating to the release or disposal of materials into the environment or otherwise relating to environmental protection. These laws and regulations may require the acquisition of a permit before drilling commences, restrict the types, quantities and concentration of substances that can be released into the environment in connection with drilling and production activities, limit or prohibit drilling activities on certain lands lying within wilderness, wetlands and other protected areas, and impose substantial liabilities for pollution resulting from our operations. Failure to comply with these laws and regulations may result in the assessment of administrative, civil and criminal penalties, incurrence of investigatory or remedial obligations or the imposition of injunctive relief. Changes in environmental laws and regulations occur frequently, and any changes that result in more stringent or costly waste handling, storage, transport, disposal or cleanup requirements could require us to make significant expenditures to maintain compliance and may otherwise have a material adverse effect on our results of operations, competitive position or financial condition as well as the industry in general. Under these environmental laws and regulations, we could be held strictly liable for the removal or remediation of previously released materials or property contamination regardless of whether we were responsible for the release or if our operations were standard in the industry at the time they were

25

Table of Contents

performed. The amount of additional future costs is not fully determinable due to such factors as the unknown magnitude of possible contamination, the unknown timing and extent of the corrective actions or compliance efforts that may be required, the determination of the Company’s liability in proportion to other responsible parties, and the extent to which such costs are recoverable from third parties.

Our operations are subject to a series of risks arising out of the threat of climate change that could result in increased operating costs, limit the areas in which we may conduct oil and natural gas exploration and production activities, and reduce demand for the oil and natural gas we produce.

In the United States, no comprehensive climate change legislation has been implemented at the federal level. However, following the U.S. Supreme Court finding that GHG emissions constitute a pollutant under the CAA, the EPA has adopted regulations that, among other things, establish construction and operating permit reviews for emissions from certain large stationary sources, require the monitoring and annual reporting of GHG emissions from certain petroleum and natural gas system sources in the United States, and together with the DOT, implement GHG emissions limits on vehicles manufactured for operation in the United States. The federal regulation of methane from oil and gas facilities has been subject to uncertainty in recent years. In September 2020, the Trump Administration revised prior regulations to rescind certain methane standards and remove the transmission and storage segments from the source category for certain regulations. However, shortly after taking office, President Biden issued an executive order directing all federal agencies to review and take action to address any federal regulations, orders, guidance documents, policies and similar agency actions promulgated during the prior administration that may be inconsistent with the current administration’s policies. In response, the U.S. Congress has approved, and President Biden has signed into law, a resolution under the Congressional Review Act to repeal the September 2020 revisions to the methane standards, effectively reinstating the prior standards. In November 2021, as required by President Biden’s executive order, the EPA proposed new regulations to establish comprehensive standards of performance and emission guidelines for methane and volatile organic compound emissions from existing operations in the oil and gas sector, including the exploration and production, transmission, processing, and storage segments. The EPA is currently seeking public comments on its proposal, which the EPA hopes to finalize by the end of 2022. Once finalized, the regulations will also need to be incorporated in state implementation plans and approved by EPA. However, all of these regulatory actions will likely be subject to legal challenges. As a result, we cannot predict the scope of any final methane regulatory requirements or the cost to comply with such requirements. However, given the long-term trend toward increasing regulation, future federal GHG regulations of the oil and gas industry remain a significant possibility.

Governmental, scientific, and public concern over the threat of climate change arising from GHG emissions has resulted in increasing political risks in the United States, including climate change related pledges made by certain candidates elected to public office. President Biden has issued several executive orders focused on addressing climate change, including items that may impact our costs to produce, or demand for, oil and gas. Additionally, in November 2021, the Biden Administration released “The Long-Term Strategy of the United States: Pathways to Net-Zero Greenhouse Gas Emissions by 2050,” which establishes a roadmap to net zero emissions in the United States by 2050 through, among other things, improving energy efficiency; decarbonizing energy sources via electricity, hydrogen, and sustainable biofuels; and reducing non-CO2 GHG emissions, such as methane and nitrous oxide. The Biden Administration is also considering revisions to the leasing and permitting programs for oil and gas development on federal lands. Litigation risks are also increasing, as a number of entities have sought to bring suit against oil and natural gas companies in state or federal court, alleging, among other things, that such companies created public nuisances by producing fuels that contributed to climate change. Suits have also been brought against such companies under shareholder and consumer protection laws, alleging that companies have been aware of the adverse effects of climate change but failed to adequately disclose those impacts.

There are also increasing financial risks for fossil fuel producers as shareholders currently invested in fossil-fuel energy companies may elect in the future to shift some or all of their investments into other sectors. Institutional lenders who provide financing to fossil-fuel energy companies also have become more attentive to sustainable lending practices and some of them may elect not to provide funding for fossil fuel energy companies. For example, at COP26, the Glasgow Financial Alliance for Net Zero (“GFANZ”) announced that commitments from over 450 firms across 45 countries had resulted in over $130 trillion in capital committed to net zero goals. The various sub-alliances of GFANZ generally require participants to set short-term, sector-specific targets to transition their financing, investing, and/or underwriting activities to net zero emissions by 2050. There is also a risk that financial institutions will be required to adopt policies that have the effect of reducing the funding provided to the fossil fuel sector. President Biden signed an executive order calling for the development of a “climate finance plan” and, separately, the Federal Reserve has joined the Network for Greening the Financial System (“NGFS”), a consortium of financial regulators focused on addressing climate-related risks in the financial sector. More recently, in November 2021, the Federal Reserve issued a statement in support of the efforts of the NGFS to

26

Table of Contents

identify key issues and potential solutions for the climate-related challenges most relevant to central banks and supervisory authorities. Limitation of investments in and financings for fossil fuel energy companies could result in the restriction, delay or cancellation of drilling programs or development or production activities.

The adoption and implementation of new or more stringent international, federal or state legislation, regulations or other regulatory initiatives that impose more stringent standards for GHG emissions from the oil and natural gas sector or otherwise restrict the areas in which this sector may produce oil and natural gas or generate GHG emissions could result in increased costs of compliance or costs of consuming, and thereby reduce demand for, oil and natural gas. Additionally, political, litigation and financial risks may result in us restricting or cancelling production activities, incurring liability for infrastructure damages as a result of climatic changes, or having an impaired ability to continue to operate in an economic manner. One or more of these developments could have a material adverse effect on our business, financial condition and results of operations.

As a final note, climate change could have an effect on the severity of weather (including hurricanes, droughts and floods), sea levels, the arability of farmland, water availability and quality, and meteorological patterns. If such effects were to occur, our development and production operations have the potential to be adversely affected.

Potential adverse effects could include damages to our facilities from powerful winds, extreme temperatures, or rising waters in low lying areas, disruption of our production activities either because of climate related damages to our facilities or in our costs of operation potentially arising from such climatic effects, less efficient or non- routine operating practices necessitated by climate effects or increased costs for insurance coverage in the aftermath of such effects. Significant physical effects of climate change could also have an indirect effect on our financing and operations by disrupting the transportation or process-related services provided by midstream companies, service companies or suppliers with whom we have a business relationship. Additionally, changing meteorological conditions, particularly temperature, may result in changes to the amount, timing, or location of demand for energy or the products we produce. We may not be able to recover through insurance some or any of the damages, losses or costs that may result from potential physical effects of climate change. At this time, we have not developed a comprehensive plan to address the legal, economic, social or physical impacts of climate change on our operations.

Risks Relating to Our Capital Structure

If our indebtedness increases, it could reduce our financial flexibility.

We have a credit facility in place with $350 million in commitments for borrowings and letters of credit. As of December 31, 2021, $290 million was outstanding on our credit facility. If we further utilize this facility, the level of our indebtedness could affect our operations in several ways, including the following:

a significant portion of our cash flow could be used to service the indebtedness;
a high level of debt would increase our vulnerability to general adverse economic and industry conditions;
the covenants contained in our credit facility limit our ability to borrow additional funds, dispose of assets, pay dividends and make certain investments, and;
a high level of debt could impair our ability to obtain additional financing in the future for working capital, capital expenditures, acquisitions, general corporate or other purposes.

In addition, our bank borrowing base is subject to semi-annual redeterminations. We could be required to repay a portion of our bank borrowings due to redeterminations of our borrowing base. If we are required to do so, we may not have sufficient funds to make such repayments, and we may need to negotiate renewals of our borrowings or arrange new financing or sell significant assets. Any such actions could have a material adverse effect on our business and financial results.

27

Table of Contents

We may be unable to access the equity or debt capital markets to meet our obligations.

Our plans for growth may include accessing the capital markets. Recent reluctance to invest in the exploration and production sector based on market volatility, historically perceived underperformance, and Environmental, Social and Governance (ESG) trends, among other things, has raised concerns regarding capital availability for the sector. If those markets are unavailable, or if we are unable to access alternative means of financing on acceptable terms, we may be unable to implement all of our development plans, make acquisitions or otherwise carry out our business strategy, which would have a material adverse effect on our financial condition and results of operations and impair our ability to service our indebtedness.

Risks Relating to Technology and Cybersecurity

We rely on computer and telecommunications systems, and failures in our systems or cyber security attacks or breaches could result in information theft, data corruption, disruption in operations and/or financial loss.

The oil and natural gas industry has become increasingly dependent upon digital technologies to conduct day-to-day operations including certain exploration, development and production activities. We depend on digital technology to estimate quantities of oil and natural gas reserves, process and record financial and operating data, analyze seismic and drilling information, process and store personally identifiable information on our employees and royalty owners and communicate with our employees and other third parties. Our business partners, including vendors, service providers, purchasers of our production and financial institutions, are also dependent on digital technology. It is possible that we could incur interruptions from cyber security attacks or breaches, computer viruses or malware that could result in disruption of our business operations and/or financial loss. Although we utilize various procedures and controls to monitor and protect against these threats and mitigate our exposure to such threats, there can be no assurance that these procedures and controls will be sufficient in preventing security threats from materializing and causing us to suffer losses in the future. Even so, any cyber incidents or interruptions to our computing and communications infrastructure or our information systems could lead to data corruption, communication interruption, unauthorized release, gathering, monitoring, misuse or destruction of proprietary or other information, or otherwise significantly disrupt our business operations. As cyber threats continue to evolve, we may be required to expend significant additional resources to continue to modify or enhance our protective measures or to investigate and remediate any information security vulnerabilities.

Risks Relating to Our Common Stock

The market price of our common stock may be volatile, which could cause the value of your investment to decline.

The stock markets have experienced extreme volatility that has often been unrelated to the operating performance of particular companies. These broad market fluctuations may adversely affect the trading price of our common stock. The market price of our common stock may also fluctuate significantly in response to the following factors, some of which are beyond our control:

our operating and financial performance and prospects;
variations in our quarterly operating results and changes in our liquidity position;
investor perceptions of us and the industry and markets in which we operate;
future sales, or the availability for sale, of equity or equity-related securities;
changes in securities analysts’ estimates of our financial performance;
changes in market valuations of similar companies;
changes in the price of oil and natural gas; and
general financial, domestic, economic and other market conditions.

28

Table of Contents

We have no current plans to pay dividends on our common stock.

We do not currently anticipate paying any cash dividends on our common stock. We currently intend to retain future earnings, if any, to pay down debt and finance the expansion of our business. Our future dividend policy is within the discretion of our Board of Directors and will depend upon various factors, including our business, financial condition, results of operations, capital requirements and investment opportunities. In addition, our credit facility currently prohibits us from paying dividends.

Our Board of Directors can, without stockholder approval, cause preferred stock to be issued on terms that could adversely affect common stockholders.

Under our Articles of Incorporation, our Board of Directors is authorized to issue up to 50,000,000 shares of preferred stock, of which none are issued and outstanding as of the date of this Annual Report. Also, our Board of Directors, without stockholder approval, may determine the price, rights, preferences, privileges and restrictions, including voting rights, of those shares. If the Board of Directors causes shares of preferred stock to be issued, the rights of the holders of our common stock could be adversely affected. The Board of Director’s ability to determine the terms of preferred stock and to cause its issuance, while providing desirable flexibility in connection with possible acquisitions and other corporate purposes, could have the effect of making it more difficult for a third party to acquire a majority of our outstanding voting stock. Preferred shares issued by the Board of Directors could include voting rights, or even super voting rights, which could shift the ability to control the Company to the holders of the preferred stock. Preferred shares could also have conversion rights into shares of common stock at a discount to the market price of the common stock which could negatively affect the market for our common stock. In addition, preferred shares would typically have preference in the event of liquidation of the Company, which means that the holders of preferred shares would be entitled to receive the net assets of the Company distributed in liquidation before the common stockholders receive any distribution of the liquidated assets. We have no current plans to issue any shares of preferred stock.

Provisions under Nevada law could delay or prevent a change in control of our company, which could adversely affect the price of our common stock.

In addition to the ability of the Board of Directors to issue preferred stock, the existence of some provisions under Nevada law could delay or prevent a change in control of the Company, which could adversely affect the price of our common stock. Nevada law imposes some restrictions on mergers and other business combinations between us and any holder of 10% or more of our outstanding common stock.

Item 1B:

Unresolved Staff Comments

None.

29

Table of Contents

Item 2:

Properties

General Background

Ring is currently engaged in oil and natural gas development, production, acquisition, and exploration activities currently focused in Texas and New Mexico.

Management’s Business Strategy Related to Properties

Our goal is to increase stockholder value by investing in oil and natural gas projects with attractive rates of return on capital employed. We plan to achieve this goal by exploiting and developing our existing oil and natural gas properties and pursuing strategic acquisitions of additional properties.

Developing and Exploiting Existing Properties

We believe that there is significant value to be created by drilling the identified undeveloped opportunities on our properties. As of December 31, 2021, we owned interests in a total of 60,882 gross (50,981 net) developed acres and operate the vast majority of our acreage position. In addition, as of December 31, 2021, we owned interests in approximately 22,722 gross (13,399 net) undeveloped acres. While our near-term plans are focused towards drilling wells on our existing acreage to develop the potential contained therein, our long-term plans also include continuing to evaluate acquisition and leasing opportunities that can earn attractive rates of return on capital employed.

Pursuing Profitable Acquisitions

We have historically pursued acquisitions of properties that we believe to have exploitation and development potential comparable to our existing inventory of drilling locations. We have an experienced team of management, engineering, geoscience, and land professionals who identify and evaluate acquisition opportunities, negotiate and close purchases and manage acquired properties.

Summary of Oil and Natural Gas Properties and Projects

Significant Operations

Northwest Shelf –Yoakum, Runnels and Coke County, Texas and Lea County, New Mexico – In 2019, we acquired properties consisting of 49,754 gross (38,230 net) acres with an average working interest of 77% and an average net revenue interest of 58%.  As of December 31, 2021, our acreage position in these counties is 35,810 gross (25,655 net) acres with 17,950 gross (13,662 net) developed acres held by production and 17,860 gross (11,993 net) undeveloped acres. Our reserve estimates include 79 identified proved horizontal drilling locations and 11 proved vertical drilling locations. Our reserve estimates include the capital costs required to develop these wells. We believe the Northwest Shelf leases contain additional potential drilling locations.

Central Basin Platform - Andrews and Gaines County, Texas leases – In 2011, we acquired a 100% working interest and a 75% net revenue interest in our initial leases in Andrews and Gaines counties. Since that time, we have acquired working and net revenue interests in additional producing leases and acquired additional undeveloped acreage in and around our Andrews County and Gaines County leases. The working interests range from 1-100% and the net revenue interests range from 1-88%. In total as of December 31, 2021, we own 29,065 gross (20,288 net), acres with 24,203 gross (18,882 net) developed acres held by production and the remaining 4,862 gross (1,406 net) acres being undeveloped. Our reserve estimates include 2 vertical and 38 horizontal PUD wells in this area.  Our reserve estimates include the capital costs required to develop these wells.  We believe the Central Basin Platform leases contain additional potential drilling locations.

Delaware Basin - Culberson and Reeves County, Texas leases – In 2015, we acquired properties consisting of 19,983 gross (19,679 net) acres with an average working interest of 98% and an average net revenue interest of 79%.  Since that time, we have acquired additional undeveloped acreage in and around our Culberson and Reeves County leases. In total as of December 31, 2021, we own 18,729 gross (18,437 net) acres, all of which is developed and held by production (no undeveloped acreage). Our reserve estimates include 5 vertical and 4 horizontal PUD wells. Our reserve estimates include the capital costs required to develop these wells. We believe the Delaware Basin leases contain additional potential drilling locations.

30

Table of Contents

Title to Properties

We generally conduct a preliminary title examination prior to the acquisition of properties or leasehold interests. Prior to commencement of operations on such acreage, a thorough title examination is usually conducted and any significant defects are remedied before proceeding with operations. We believe the title to our leasehold properties is good, defensible and customary with practices in the oil and natural gas industry, subject to such exceptions that we believe do not materially detract from the use of such properties. With respect to our properties of which we are not the record owner, we rely on contracts with the owner or operator of the property or assignment of leases, pursuant to which, among other things, we generally have the right to have our interest placed on record.

Our properties are generally subject to royalty, overriding royalty and other interests customary in the industry, liens incident to lending agreements, current taxes and other customary burdens, minor encumbrances, easements and restrictions. We do not believe any of these burdens will materially interfere with our use of these properties.

Summary of Oil and Natural Gas Reserves

As of December 31, 2021, our estimated proved reserves had a pre-tax PV-10 value of approximately $1,332.1 million and a Standardized Measure of Discounted Future Net Cash Flows of approximately $1,137.4 million, 100% of which relates to our properties in the Permian Basin in Texas and New Mexico. We spent approximately $95.1 million on acquisitions and capital projects during 2020 and 2021. We expect to further develop these properties through additional drilling.

The following table summarizes our total net proved reserves, pre-tax PV-10 value and Standardized Measure of Discounted Future Net Cash Flows as of December 31, 2021.  All of our reserves are in the Permian Basin in Texas and New Mexico.


Standardized

Measure of

Oil

Natural

Total

Pre-Tax PV-10

Discounted Future

(Bbl)

Gas (Mcf)

(Boe) (1)

Value (2)

Net Cash Flows

65,838,609


71,773,789


77,800,907

$

1,332,097,625

$

1,137,364,848

(1)Six Mcf is the equivalent of one Boe.

(2)PV-10 is a non-GAAP financial measure. See below for a reconciliation.

The Company presents the pre-tax PV-10 value, which is a non-GAAP financial measure, because it is a widely used industry standard which we believe is useful to those who may review this Annual Report when comparing our asset base and performance to other comparable oil and natural gas exploration and production companies. PV-10 is a non-GAAP measure that differs from a measure under GAAP known as “standardized measure of discounted future net cash flows” in that PV-10 is calculated without including future income taxes. PV-10 does not necessarily represent the fair market value of oil and natural gas properties. PV-10 is not a measure of financial or operational performance under GAAP, nor should it be considered in isolation or as a substitute for the standardized measure of discounted future net cash flows as defined under GAAP.

The table below provides a reconciliation of PV-10 to the standardized measure of discounted future net cash flows (in thousands):

Present value of estimated future net revenues


$

1,332,098

Future income taxes, discounted at 10%

$

194,733

Standardized measure of discounted future net cash flows

$

1,137,365

31

Table of Contents

Reserve Quantity Information

Our estimates of proved reserves and related valuations are based on reports independently determined and prepared by Cawley, Gillespie & Associates, Inc., independent petroleum engineers. These reserves are attributable solely to properties within the United States. A summary of the changes in quantities of proved (developed and undeveloped) oil and natural gas reserves is shown below.


Oil (Bbl)


Gas (Mcf)


Boe (1)

Balance, December 31, 2019


71,359,014

58,271,882

81,070,994

Extensions, discoveries and improved recovery


3,495,210


1,824,310

3,799,262

Production


(2,801,528)


(2,494,501)

(3,217,278)

Revisions of previous quantity estimates


(5,788,410)


3,703,336

(5,171,187)

Balance, December 31, 2020


66,264,286


61,305,027

76,481,791

Purchase of minerals in place


2,180,497


824,512

2,317,916

Extensions, discoveries and improved recovery


3,975,675


5,172,392

4,837,740

Sales of minerals in place

(462,970)

(555,879)

(555,617)

Production


(2,686,940)


(2,535,188)

(3,109,471)

Revisions of previous quantity estimates


(3,431,939)


7,562,925

(2,171,452)

Balance, December 31, 2021


65,838,609


71,773,789

77,800,907

(1)Six Mcf is the equivalent of one Boe.

Revisions represent changes in previous reserves estimates, either upward or downward, resulting from new information normally obtained from development drilling and production history or resulting from a change in economic factors, such as commodity prices, operating costs or development costs.

During the year ended December 31, 2021, the Company’s extensions and discoveries of 4,838 MBOE resulted primarily from new proved undeveloped locations resulting from the 2021 operated drilling program in the Northwest Shelf and Central Basin Platform as well as non-operated activity in the Northwest Shelf. Negative revisions of 2,172 MBOE were the result of Delaware PUD removal due to the 5 Year Rule, well performance, and increased cost from 2021 industry activity increase partially offset by commodity price increases.

Our proved oil and natural gas reserves are shown below.

32

Table of Contents

For the Years Ended December 31,


2021


2020

Oil (Bbls)


Developed


36,820,824


38,260,638

Undeveloped


29,017,785


28,003,648

Total


65,838,609


66,264,286

Natural Gas (Mcf)


Developed


39,748,880


34,335,520

Undeveloped


32,024,909


26,969,507

Total


71,773,789


61,305,027

Total (Boe)


Developed


43,445,637


43,983,225

Undeveloped


34,355,270


32,498,566

Total


77,800,907


76,481,791

Standardized Measure of Discounted Future Net Cash Flows

Our standardized measure of discounted future net cash flows relating to proved oil and natural gas reserves and changes in the standardized measure as described below were prepared in accordance with generally accepted accounting principles.

Future income tax expenses are calculated by applying appropriate year-end tax rates to future pre-tax net cash flows relating to proved oil and natural gas reserves, less the tax basis of properties involved. Future income tax expenses give effect to permanent differences, tax credits and loss carryforwards relating to the proved oil and natural gas reserves. Future net cash flows are discounted at a rate of 10% annually to derive the standardized measure of discounted future net cash flows. This calculation procedure does not necessarily result in an estimate of the fair market value of our oil and natural gas properties.

Our estimates of reserves and future cash flow as of December 31, 2021 and 2020 were prepared using an average price equal to the unweighted arithmetic average of the first day of the month price for each month within the 12-month periods ended December 31, 2021 and 2020, respectively, in accordance with SEC guidelines. As of December 31, 2021, our reserves are based on an SEC average price of $63.04 per Bbl of WTI oil posted and $3.598 per MMBtu of Henry Hub natural gas. As of December 31, 2020, our reserves are based on an SEC average price of $36.04 per Bbl of WTI oil posted and $1.99 per MMBtu Henry Hub natural gas. Prices are adjusted by local field and lease level differentials and are held constant for life of reserves in accordance with SEC guidelines.

The standardized measure of discounted future net cash flows relating to the proved oil and natural gas reserves are shown below.

Standardized Measure of Discounted Future Net Cash Flows

33

Table of Contents

December 31, 


2021


2020


2019

Future cash inflows

$

4,853,709,000

$

2,682,488,655

$

3,825,773,515

Future production costs

(1,395,437,250)


(821,515,126)


(964,887,856)

Future development costs

(347,757,000)


(244,323,270)


(252,457,833)

Future income taxes

(501,586,949)


(208,645,934)


(424,715,966)

Future net cash flows

2,608,927,801


1,408,004,325


2,183,711,860

10% annual discount for estimated timing of cash flows

(1,471,562,953)


(852,133,072)


(1,260,536,809)


Standardized Measure of Discounted Future Net Cash Flows

$

1,137,364,848

$

555,871,253

$

923,175,051

The changes in the standardized measure of discounted future net cash flows relating to the proved oil and natural gas reserves are shown below.

Changes in Standardized Measure of Discounted Future Net Cash Flows


2021


2020


2019

Beginning of the year

$

555,871,253

$

923,175,051

$

455,944,641

Purchase of minerals in place

33,688,718


598,489,190

Extensions, discoveries and improved recovery

79,003,885


61,303,074


334,641,933

Development costs incurred during the year

17,513,180


29,916,746


152,125,320

Sales of oil and gas produced, net of production costs

(154,615,685)


(70,634,853)


(137,663,314)

Sales of minerals in place

(2,523,746)


(30,174,528)

Accretion of discount

63,810,764


92,838,323


47,463,292

Net changes in price and production costs

636,884,944


(368,974,767)


(219,608,128)

Net change in estimated future development costs

(44,357,751)


(3,883,985)


47,617,158

Revisions of previous quantity estimates

(22,259,508)


(66,213,586)


(126,143,669)

Changes in estimated timing of cash flows

86,845,188


(139,039,115)


(107,443,484)

Net change in income taxes

(112,496,394)


97,384,365


(92,073,360)


End of the Year

$

1,137,364,848

$

555,871,253

$

923,175,051

34

Table of Contents

Our proved reserves by state as of December 31, 2021 are summarized in the table below.


Standardized


Measure of

Discounted Future

Future Capital

% of Total

Pre-tax PV-10

Net Cash Flows

Expenditures


Oil (Bbl)


Gas (Mcf)


Total (Boe)


Proved


(In thousands)


(In thousands)


(In thousands)

Texas

PD


34,437,795


37,424,268


40,675,173


52

%  

$

748,346

$

638,949

$

53,892

PUD


28,054,230


31,210,705


33,256,014


43

%  


516,430


440,936


280,458

Total Proved:


62,492,025


68,634,973


73,931,187


95

%  

$

1,264,776

$

1,079,884

$

334,350

New Mexico

PD

2,383,029

2,324,612

2,770,464

4

%  

$

46,169

$

39,420

$

1,228

PUD

963,555

814,204

1,099,256

1

%  

21,153


18,061

12,179

Total Proved:

3,346,584

3,138,816

3,869,720

5

%  

$

67,322

$

57,481

$

13,407

Total

PD

36,820,824

39,748,880

43,445,637

56

%  

$

794,515

$

678,369

$

55,120

PUD

29,017,785

32,024,909

34,355,270

44

%  

537,583


458,996

292,637

Total Proved:

65,838,609

71,773,789

77,800,907

100

%  

$

1,332,098

$

1,137,365

$

347,757

Proved Reserves

We have approximately 77.8 million BOE of proved reserves, consisting of approximately 85% oil and 15% natural gas, as summarized in the table above as of December 31, 2021. Our reserve estimates have not been filed with any Federal authority or agency (other than the SEC).

As of December 31, 2021, approximately 56% of the proved reserves have been classified as proved developed, or “PD” and the remaining 44% are proved undeveloped, or “PUD”.

As of December 31, 2021, our total proved reserves had a net pre-tax PV-10 value of approximately $1,332.1 million and a Standardized Measure of Discounted Future Net Cash Flows of approximately $1,137.4 million. Approximately $794.5 million and $678.4 million, respectively, of total proved reserves are associated with the PD reserves, which is approximately 60% of the total proved reserves’ pre-tax PV-10 value. The remaining $537.6 million and $459.0 million, respectively, are associated with PUD reserves.

Proved Undeveloped Reserves

Our reserve estimates as of December 31, 2021 include approximately 34.4 million BOE as proved undeveloped reserves. As of December 31, 2020, our reserve estimates included approximately 32.5 million BOE as proved undeveloped reserves. Below is a description of the changes in our PUD reserves from December 31, 2020 to December 31, 2021.

During the year ended December 31, 2021, we incurred costs of approximately $22.9 million to convert 2,899 MBOE of reserves from PUD to PD through development.

The increase in proved undeveloped reserves was primarily attributable to extensions of 4,110 MBOE resulting primarily from the 2021 operated drilling program in the Northwest Shelf and Central Basin Platform as well as non-operated activity in the Northwest Shelf.

35

Table of Contents

The following table indicates projected reserves that we currently estimate will be converted from proved undeveloped to proved developed, as well as the estimated costs per year involved in such development.

Estimated Costs Related to Conversion of Proved Undeveloped Reserves to Proved Developed Reserves


Estimated Oil


Estimated Gas


Reserves

Reserves

Estimated

Year


Developed (Bbls)


Developed (Mcf)


Total Boe


Development Costs

2022


8,671,710


8,665,935


10,116,032

89,000,630

2023


12,828,397


12,188,540


14,859,821


123,533,117

2024


7,353,579


9,896,043


9,002,919


76,828,066

2025

164,099

1,274,390

376,497

3,275,000


29,017,785


32,024,908


34,355,269

$

292,636,813

Preparation and Internal Controls Over Reserves Estimates

All the proved oil and natural gas reserves disclosed in this report are based on reserve estimates determined and prepared by independent reserve engineers Cawley, Gillespie & Associates (“CGA”), a leader of petroleum property analysis for industry and financial institutions. CGA was founded in 1960 and performs consulting petroleum engineering services under Texas Board of Professional Engineers Registration No. F-693. Within CGA, the technical person primarily responsible for preparing the estimates set forth in the CGA letter dated February 28, 2022, filed as an exhibit to this Annual Report on Form 10-K, was Mr. Zane Meekins. Mr. Meekins has been a practicing consulting petroleum engineer at CGA since 1989. Mr. Meekins is a Registered Professional Engineer in the State of Texas (License No. 71055) and has over 31 years of practical experience in petroleum engineering, with over 31 years of experience in the estimation and evaluation of reserves. He graduated from Texas A&M University in 1987 with a Bachelor of Science degree in Petroleum Engineering. Mr. Meekins meets or exceeds the education, training, and experience requirements set forth in the Standards Pertaining to the Estimating and Auditing of Oil and Gas Reserves Information promulgated by the Society of Petroleum Engineers; he is proficient in judiciously applying industry standard practices to engineering and geoscience evaluations as well as applying SEC and other industry reserve definitions and guidelines.

The proved oil and natural gas reserves disclosed in this report are based on reserve estimates determined and prepared by independent reserve engineers primarily using decline curve analysis to determine the reserves of individual producing wells. To establish reasonable certainty with respect to our estimated proved reserves, the independent reserve engineers employed technologies that have been demonstrated to yield results with consistency and repeatability. Reserves attributable to producing wells with limited production history and for undeveloped locations were estimated using volumetric estimates or performance from analogous wells in the surrounding area. These wells were considered to be analogous based on production performance from the same formation and completions using similar techniques. The technologies and economic data used to estimate our proved reserves include, but are not limited to, well logs, geological maps, seismic data, well test data, production data, historical price and cost information and property ownership interests. This data was reviewed by various levels of management for accuracy before consultation with independent reserve engineers. This consultation included review of properties, assumptions and available data. Internal reserve estimates were compared to those prepared by independent reserve engineers to test the estimates and conclusions before the reserves were included in this report. The accuracy of the reserve estimates is dependent on many factors, including the following:

the quality and quantity of available data and the engineering and geological interpretation of that data;
estimates regarding the amount and timing of future costs, which could vary considerably from actual costs;
the accuracy of economic assumptions; and
the judgment of the personnel preparing the estimates.

Ring’s Executive Vice President of Engineering and Corporate Strategy, Mr. Alex Dyes, is the technical professional primarily responsible for overseeing the preparation of our reserves estimates. He has a Bachelor of Science degree in Petroleum Engineering from the University of Texas with over 15 years of practical industry experience, including over 11 years of estimating and evaluating

36

Table of Contents

reserve information. He is a member of the Society of Petroleum Engineers since 2013 and his qualifications meet or exceed the Society of Petroleum Engineers’ standard requirements to be a professionally qualified Reserve Estimator and Auditor.

We encourage ongoing professional education for our engineers and analysts on new technologies and industry advancements as well as refresher training on basic skill sets. In order to ensure the reliability of reserves estimates, the Corporate Reserves department follows comprehensive SEC-compliant internal controls and policies to determine, estimate and report proved reserves including:

confirming that we include reserves estimates for all properties owned and that they are based upon proper working and net revenue interests;
ensuring the information provided by other departments within the Company such as Accounting is accurate;
communicating, collaborating, and analyzing with technical personnel in our business units;
comparing and reconciling the internally generated reserves estimates to those prepared by third parties; and
utilizing experienced reservoir engineers or those under their direct supervision to prepare reserve estimates.

Each quarter, the Executive Vice President of Engineering and Corporate Strategy presents the status of the Company’s reserves to senior executives, and subsequently obtains approval of significant changes from key executives. Additionally, the five-year PUD development plan is reviewed and approved annually by the Company’s Chief Executive Officer, Chief Financial Officer, Executive Vice President of Operations, and the Executive Vice President of Land, Legal, Human Resources, and Marketing.

The Corporate Reserves department works closely with independent petroleum consultants at each fiscal year end to ensure the integrity, accuracy and timeliness of annual independent reserves estimates. These independently developed reserves estimates are presented to the Audit Committee. In addition to reviewing the independently developed reserve reports, the Audit Committee also periodically meets with the independent petroleum consultants that prepare estimates of proved reserves.

Summary of Oil and Natural Gas Properties and Projects

Acreage

The following table summarizes gross and net developed and undeveloped acreage as of December 31, 2021 by region (net acreage is our percentage ownership of gross acreage). Acreage in which our interest is limited to royalty and overriding royalty interests is excluded.


Developed Acreage


Undeveloped Acreage


Total Acreage


Gross


Net


Gross


Net


Gross


Net

Central Basin Platform


24,203


18,882


4,862


1,406


29,065


20,288

Delaware Basin


18,729


18,437


18,729


18,437

Northwest Shelf

17,950

13,662

17,860

11,993

35,810

25,655

Total


60,882


50,981


22,722


13,399


83,604


64,380

Leases of undeveloped acreage will generally expire at the end of their respective primary terms unless production from such leasehold acreage has been established prior to expiration of such primary term. If production is established on such acreage, the lease will generally remain in effect until the cessation of production from such acreage and is referred to in the industry as “Held-By-Production” or “HBP.”  Leases of undeveloped acreage may terminate or expire as a result of not meeting certain drilling commitments, if any, or otherwise by not complying with the terms of a lease depending on the specific terms that are negotiated between lessor and lessee.

37

Table of Contents

The following table sets forth the gross and net undeveloped acreage, as of December 31, 2021, under lease which would expire over the next three years unless (i) production is established on the lease or within a spacing unit of which the lease is participating, or (ii) the lease is renewed or extended prior to the relevant expiration dates:

Undeveloped acreage


2022


2023


2024


Gross


Net


Gross


Net


Gross


Net

Central Basin Platform

3,241


371

360


40

960


895

Delaware Basin

Northwest Shelf

9,946

5,626

7,818

2,032

7,088

266

Total


13,187


5,997


8,178


2,072


8,048


1,161

Production History

The following table presents the historical information about our produced natural gas and oil volumes for the years ended December 31, 2021, 2020, and 2019:

Years Ended December 31,


2021


2020


2019

Oil (Bbls)


Central Basin Platform


867,835


958,691


1,590,473

Delaware Basin


104,129

159,635


275,080

Northwest Shelf

1,714,976

1,683,202

1,670,573

Total


2,686,940


2,801,528


3,536,126


Gas (Mcf)


Central Basin Platform


171,690


268,495


315,228

Delaware Basin


288,918


468,177


939,437

Northwest Shelf

2,074,580

1,757,830

1,221,807

Total


2,535,188


2,494,502


2,476,472


Total production (BOE)


Central Basin Platform


896,087


1,003,440


1,643,011

Delaware Basin


152,282


237,665


431,653

Northwest Shelf

2,060,739

1,976,173

1,874,207

Total


3,109,108


3,217,278


3,948,871


Daily production (Boe/d)


Central Basin Platform


2,455


2,742


4,501

Delaware Basin


417


649


1,183

Northwest Shelf

5,646

5,399

5,135

Total


8,518


8,790


10,819

38

Table of Contents

Production Prices and Production Costs

The following tables provides historical pricing and costs statistics for the years ended December 31, 2021, 2020, and 2019.

Years Ended December 31,


2021


2020


2019

Average sales price:


Oil (per Bbl)

Central Basin Platform

$

67.66

$

39.64

$

53.89

Delaware Basin


65.98


35.00


52.70

Northwest Shelf


67.61


38.93


54.88

Total

$

67.56

$

38.95

$

54.27

Natural gas (per Mcf)

Central Basin Platform

$

4.63

$

1.12

$

1.70

Delaware Basin

4.75

0.54

1.01

Northwest Shelf

6.08

1.91

1.91

Total

$

5.83

$

1.57

$

1.54

Total (per Boe)

Central Basin Platform

$

66.42

$

38.17

$

52.49

Delaware Basin

54.13

24.57

35.77

Northwest Shelf

62.38

34.86

50.16

Total

$

63.14

$

35.13

$

49.56


Years Ended December 31,


2021


2020


2019

Average lease operating expenses (per Boe)


Central Basin Platform


$

15.97

$

15.44

$

14.31

Delaware Basin


32.75


19.13


14.26

Northwest Shelf


5.34


4.91


6.70

Total


$

9.75

$

9.25

$

10.69

Average gathering, transportation and


processing costs (per Boe)


Central Basin Platform


Delaware Basin


Northwest Shelf


2.10


2.07


1.53

Total


$

1.39

$

1.27

$

0.73

Average ad valorem taxes (per Boe)


Central Basin Platform


$

1.17

$

1.82

$

1.16

Delaware Basin


0.33


0.50


0.49

Northwest Shelf


0.57


0.60


0.69

Total


$

0.73

$

0.97

$

0.86

Average production taxes (per Boe)


Central Basin Platform


$

2.85

$

1.67

$

2.28

Delaware Basin


2.45


1.30


1.85

Northwest Shelf


3.01


1.64


2.45

Total


$

2.93

$

1.63

$

2.31

39

Table of Contents

The average oil sales price amounts above are calculated by dividing revenue from oil sales by the volume of oil sold, in barrels “Bbl.” The average natural gas sales price amounts above are calculated by dividing revenue from natural gas sales by the volume of natural gas sold, in thousand cubic feet “Mcf.” The total average sales price amounts are calculated by dividing total revenues by total volume sold, in BOE. The average production costs above are calculated by dividing production costs by total production in BOE.

Productive Wells

The following table presents our ownership as of December 31, 2021 in productive oil and natural gas wells (a net well is our percentage ownership of a gross well).  All of such wells are in the Permian Basin in Texas and New Mexico.

Oil Wells

Gas wells

Total Wells

Gross


Net


Gross


Net


Gross


Net

491


333


491


333

Drilling Activity

During 2021, we drilled 11 gross (9.91 net) wells in the Northwest Shelf and Central Basin Platform in the Permian Basin.  We completed and placed on production each of these wells during 2021, and completed and placed on production two gross (1.998 net) wells that were drilled in December 2020. In addition, Ring also participated in two gross (.23 net) non-operated wells in the Northwest shelf. These wells were successful and there were no dry wells.

The table below contains information regarding the number of wells drilled and participated in during the periods indicated.

For the year ended December 31,

2021

2020

2019


Gross


Net


Gross


Net


Gross


Net

Exploratory

Productive


Dry


Development


Productive


13.00


10.14


6.00


5.61


30.00


29.33

Dry


Total


Productive


13.00


10.14


6.00


5.61


30.00


29.33

Dry


Present Activities

We had no wells in the process of being drilled or completed as of December 31, 2021.

Cost Information

We conduct our oil and natural gas activities entirely in the United States. As noted in the table under “Production Prices and Production Costs”, our average production costs, per BOE, were $11.88 and $11.49 for the years ended December 31, 2021 and 2020, respectively, and our average production taxes, per BOE, were $2.93 and $1.63 for the years ended December 31, 2021 and 2020, respectively. These amounts are calculated by dividing our total production costs or total production taxes by our total volume sold, in BOE.

Costs incurred for property acquisition, exploration and development activities for the years ended December 31, 2021 and 2020 are shown below:

40

Table of Contents


2021


2020


2019

Wishbone Acquisition (1)

$

$

$

304,392,921

Acquisition of proved properties

1,368,437

1,317,313

3,400,411

Divestiture of proved properties

(2,000,000)

(8,547,074)

Development costs


51,302,131


42,457,745

152,125,320

Total Costs Incurred

$

50,670,568

$

43,775,058

$

451,371,578

(1) Wishbone Acquisition in 2019 includes $28.3 million in fair value of stock issued as consideration in acquisitions.

Other Properties and Commitments

Effective January 1, 2021, the Company moved its corporate headquarters to The Woodlands, Texas. Prior to this, our principal offices were in Midland, Texas.  Those offices now serve as an operations office. Our office space lease in Tulsa, Oklahoma was terminated as of March 31, 2021. We expect our current office space to be adequate for the foreseeable future.

Item 3:

Legal Proceedings

The Company is a defendant in a lawsuit in Harris County District Court, Houston, Texas, styled EPUS Permian Assets, LLC, v. Ring Energy, Inc., that was filed in July 2021. The plaintiff, EPUS Permian Assets, LLC, claims breach of contract, money had and received by fraudulent inducement, unjust enrichment and constructive trust. The plaintiff is requesting its forfeited deposit of $5,500,000 in connection with a proposed property sale by the Company plus related damages, and attorneys’ fees and costs. The action relates to a proposed property sale by the Company to the plaintiff, which was extended by the Company on several occasions with the plaintiff ultimately failing to perform on the agreement and the Company keeping the deposit. The Company believes that the claims by the plaintiff are entirely without merit and is conducting a vigorous defense and counterclaim. The Company has filed an answer and a counterclaim denying the allegations and asserting affirmative defenses that would bar or substantially limit the plaintiff’s claims, asserting breach of contract and requesting a declaratory judgment and attorneys’ fees and costs. The parties are conducting discovery.

Item 4:

Mine safety disclosures

Not applicable.

PART II

Item 5:

Market for Registrant’s Common Equity, Related Stockholder Matters and Issuer Purchases of Equity Securities

Market for our Common Stock

Our common stock is listed on the NYSE American under the trading symbol “REI.”

Performance Graph

The following graph compares the cumulative 5-year total return attained by stockholders on Ring’s common stock relative to the cumulative total returns of the S&P 500 index and that of a selected peer group, named below. The graph assumes a $100 investment at the closing price on December 31, 2016, and reinvestment of dividends on the date of payment without commission. This table is not intended to forecast future performance of our common stock.

41

Table of Contents

Graphic

*The peer group consists of: Abraxas Petroleum Corporation, Amplify Energy Corp., Civitas Resources, Inc., Earthstone Energy, Inc., Laredo Petroleum, Inc., Ranger Oil Corporation, SilverBow Resources, Inc., and W&T Offshore, Inc., each of which is in the oil and natural gas exploration and production industry.

The performance graph above is furnished and not filed for purposes of Section 18 of the Exchange Acts and will not be incorporated by reference into any registration filed under the Securities Act unless specifically identified therein as being incorporated by reference. The performance graph is not solicitation material subject to Regulation 14A.

Record Holders

As of March 8, 2022, there were approximately 18,089 holders of record of our common stock.  

Dividend Policy

We do not currently anticipate paying any cash dividends on our common stock. We currently intend to retain future earnings, if any, to pay down debt and finance the expansion of our business. Our future dividend policy is within the discretion of our Board of Directors and will depend upon various factors, including our business, financial condition, results of operations, capital requirements and investment opportunities. In addition, our credit facility currently prohibits us from paying dividends.

Recent Sales of Unregistered Securities and Use of Proceeds from Registered Securities

None

Issuer Repurchases

We did not make any repurchases of our equity securities during the year ended December 31, 2021.

Item 6:

Reserved

42

Table of Contents

Item 7:

Management’s Discussion and Analysis of Financial Condition and Results of Operations

The following discussion and analysis should be read in conjunction with our accompanying financial statements and the notes to those financial statements included elsewhere in this Annual Report. The following discussion includes forward-looking statements that reflect our plans, estimates and beliefs and our actual results could differ materially from those discussed in these forward-looking statements as a result of many factors, including those discussed under “Risk Factors” and elsewhere in this Annual Report.

Overview

Ring is a growth oriented independent exploration and production company based in The Woodlands, Texas and is engaged in oil and natural gas development, production, acquisition, and exploration activities currently focused in Texas and New Mexico. Our primary drilling operations target the oil and liquids rich producing formations in the Northwest Shelf, the Central Basin Platform, and the Delaware Basin all of which are part of the Permian Basin in Texas and New Mexico.

Business Description and Plan of Operation

The Company is focused on balancing the need to reduce long-term debt and further developing our oil and gas properties to maintain or grow our annual production. We intend to achieve both through proper allocation of cash flow generated by our operations and potentially through the sale of non-core assets. We intend to continue evaluating potential transactions to acquire strategic producing assets with attractive acreage positions that can provide competitive returns for our shareholders.

2021 Developments and Highlights

As the weak commodity price environment began to recover and the contraction in oil demand seen from the COVID-19 pandemic began to ease, Ring initiated its Phase I four well program in the Northwest Shelf Asset by drilling two wells in December 2020 and two wells in January 2021.  All four wells were completed and placed on production during first quarter 2021.  During that quarter, the Company also performed nine conversions from electrical submersible pumps to rod pumps (such conversions, “CTRs”) with seven performed in the Northwest Shelf and two in the Central Basin Platform. New wells were added throughout the year by drilling in phases, to ensure the Company would continue operating within cash flow.  In the second quarter of 2021, the Company completed its Phase II drilling program and placed on production three new horizontal San Andres wells in the Northwest Shelf, along with four additional CTRs in the Northwest Shelf and one CTR in the Central Basin Platform. in the third quarter of 2021, the Phase III drilling program resulted in two horizontal San Andres wells in Northwest Shelf and two horizontal San Andres wells in the Central Basin Platform. During third quarter 2021, the Company also performed seven CTRs in the Northwest Shelf and three CTRs in the Central Basin Platform.  In the fourth quarter of 2021, the Company drilled one new well and performed one CTR in the Northwest Shelf and drilled one new well in the Central Basin Platform.  Lastly, during 2021 the Company participated with offset operators in two wells in the Northwest Shelf Asset as a non-operated working interest owner.  

Our oil and natural gas producing properties are located in the Permian Basin of Texas and New Mexico. Oil sales represented approximately 92.5% and 96.5% of our total revenue for the twelve months ended December 30, 2021 and 2020, respectively. The 4% variance in oil sales revenue was due to higher realized gas and NGL prices in 2021. As of December 31, 2021, we had in place derivative contracts covering 3,129 barrels of oil per day for the calendar year 2022. All of the 3,129 barrels of oil in 2022 are in the form of swaps of WTI Crude Oil prices. The oil swap prices for 2022 range from $44.22 to $50.05, with a weighted average swap price of $46.60.  Our 2021 derivative hedges resulted in total unrealized fair value loss of approximately $25.1 million for the year ended December 31, 2021 and realized loss on derivatives of approximately $52.8 million for the year ended December 31, 2021. All of our hedges are financial hedges and do not have physical delivery requirements.

43

Table of Contents

In December 2021, the semi-annual redetermination of our lending group reaffirmed our borrowing base of $350 million, as well as continued the prior hedging requirement of 3,100 barrels per day of crude oil sales for the calendar year 2022. During the fourth quarter, the Company paid down approximately $5 million in debt leaving approximately $290 million outstanding on our credit facility as of December 31, 2021.

Market Conditions and Commodity Prices

Our financial results depend on many factors, particularly the price of crude oil and natural gas and our ability to market our production on economically attractive terms. Commodity prices are affected by many factors outside of our control, including changes in market supply and demand, which are impacted by weather conditions, pipeline capacity constraints, inventory storage levels, basis differentials and other factors. As a result, we cannot accurately predict future commodity prices and, therefore, we cannot determine with any degree of certainty what effect increases or decreases in these prices will have on our drilling program, production volumes or revenues.

The pandemic induced reduction in oil prices experienced in 2020 and the improvement of oil and natural gas prices experienced in 2021 continues to demonstrate commodity price volatility and we believe oil and natural gas prices may continue to be volatile for the foreseeable future. The ability to find and develop sufficient amounts of crude oil and natural gas reserves at economical costs are critical to our long-term success.

Results of Operations

The following table sets forth selected operating data for the periods indicated:

For the Years Ended December 31, 


2021


2020


2019

Net production:


Oil (Bbls)


2,686,940


2,801,528


3,536,126

Natural gas (Mcf)


2,535,188


2,494,502


2,476,472


Net sales:


Oil

$

181,533,093

$

109,113,557

$

191,891,314

Natural gas


14,772,873


3,911,581


3,811,517


Average sales price:


Oil (per Bbl)

$

67.56

$

38.95

$

54.27

Natural gas (per Mcf)


5.83


1.57


1.54


Production costs and expenses


Lease operating expenses

$

30,312,399

$

29,753,413

$

42,213,006

Gathering, transportation and processing costs

4,333,232

4,090,238

2,874,155

Ad valorem taxes

2,276,463

3,125,222

3,409,064

Production taxes


9,123,420


5,228,090


9,130,379

Depreciation, depletion and amortization expense


37,167,967


43,010,660


56,204,269

Ceiling test impairment


277,501,943


Gain (loss) on derivative contracts


(77,853,141)


21,366,068


(3,000,078)

Asset retirement obligation accretion

744,045


906,616


943,707

Operating lease expense

523,487

1,196,372

925,217

General and administrative expense


(excluding stock-based compensation)

13,649,782

11,509,888

16,784,081

Stock-based compensation expense

2,418,323

5,364,162

3,082,625

44

Table of Contents

Year Ended December 31, 2021 Compared to Year Ended December 31, 2020

Oil and natural gas sales. Oil and natural gas sales revenue increased from 2020 levels by approximately $83.3 million to $196.3 million in 2021. Oil sales increased approximately $72.4 million and natural gas sales increased approximately $10.9 million. The oil sales increase was the result of an increase in the average realized per barrel oil price from $38.95 in 2020 to $67.56 in 2021, slightly offset by a decrease in sales volume from 2,801,528 barrels of oil in 2020 to 2,686,940 barrels of oil in 2021. These per barrel amounts are calculated by dividing revenue from oil sales by the volume of oil sold, in barrels. Despite the few months of shut in or curtailed production due to oil price destabilizing from the COVID-19 pandemic, volumes in 2020 significantly benefited from the large amount of capital activity seen in the previous year. Likewise, the lack of capital activity in 2020 resulted in a negative impact to 2021 volumes due to natural well decline.  Activity in 2021 helped offset declines, but not enough to overcome the full impact from the reduced capital activity in 2020.

The natural gas sales volume increased from 2,494,502 Mcf in 2020 to 2,535,188 Mcf in 2021 and the average realized per Mcf gas price increased from $1.57 in 2020 to $5.83 in 2021. The price increase was driven by a steady increase in NGL prices and a 92% increase in the underlying Henry Hub gas price, which included the impact of Winter Storm Uri in 2021. These per Mcf amounts are calculated by dividing revenue from gas sales by the volume of gas sold, in Mcf. Natural gas sales volumes in 2021 were positively impacted by higher volumes associated with reservoir de-pressurization at the Northwest Shelf properties which were partially offset by purchaser inability to receive gas volumes at certain times throughout the year due to downtime or mechanical issues effecting efficiencies with their facilities.  

Lease operating expenses. Our total lease operating expenses (“LOE”) increased slightly from $29,753,413 in 2020 to $30,312,399 in 2021 and increased on a BOE basis from $9.25 in 2020 to $9.75 in 2021. These per BOE amounts are calculated by dividing our total lease operating expenses by our total volume sold, in BOE. LOE increased due to the higher amount of activity in 2021 compared to the lack of activity resulting from the oil price destabilization from the COVID-19 pandemic in 2020.

Gathering, transportation and processing costs. Our total gathering, transportation and processing costs (“GTP”) increased slightly from $4,090,238 in 2020 to $4,333,232 in 2021 and increased on a BOE basis from $1.27 in 2020 to $1.39 in 2021. GTP costs increased due to the higher gas volumes processed in the Northwest Shelf.

Ad valorem taxes. Our total ad valorem taxes decreased from $3,125,222 in 2020 to $2,276,463 in 2021 and decreased on a BOE basis from $0.97 in 2020 to $0.73 in 2021. Ad valorem taxes decreased due to the Company’s compliance department’s annual detailed review of each property’s current production, ownership, and lease operating expenses, which resulted in cost savings for the taxes assessed.

Oil and natural gas production taxes. Oil and natural gas production taxes as a percentage of oil and natural gas sales were 4.63% during 2020 and increased to 4.65% in 2021. The slight increase was due to higher Texas gas revenue which is taxed at 7.5%. Production taxes vary from state to state. Therefore, these taxes are likely to vary in the future depending on the mix of production we generate from various states (currently only Texas and New Mexico), and on the possibility that any state may raise its production tax rates.

Depreciation, depletion and amortization. Our depreciation, depletion and amortization expense decreased from $43,010,660 in 2020 to $37,167,967 in 2021. The decrease was the result of an increase in our total reserves and an average decrease of total property cost from the impairment in 2020, resulting in a reduction to our average depreciation, depletion and amortization rate from $13.37 per BOE during 2020 to $11.95 per BOE during 2021. These per BOE amounts are calculated by dividing our total depreciation, depletion and amortization expense by our total volume sold, in BOE.

Ceiling Test Write-Down. The Company did not record a ceiling test write-down during 2021. The ceiling test was calculated based upon the average of quoted market prices in effect on the first day of the month for the preceding twelve-month period as of December 31, 2021, adjusted for market differentials, per SEC guidelines. The Company recorded a non-cash write-down of the carrying value of its proved oil and natural gas properties of $277,501,943 for the year ended December 31, 2020 as a result of ceiling test limitations, which was reflected as ceiling test impairments in the accompanying Statements of Operations. The primary reason for the write-down was a reduction in the oil price used for calculating the reserves from $52.19 in 2019 to $36.04 in 2020.

45

Table of Contents

Asset retirement obligation accretion. Our asset retirement obligation (“ARO”) accretion decreased from $906,616 in 2020 to $744,045 in 2021. This was a result of the reduction of ARO liabilities from the sale of assets in the first quarter of 2021 and plugging activities throughout the year.

Operating lease expense. Our operating lease expense decreased from $1,196,372 in 2020 to $523,487 in 2021 due to the month to month leases for office equipment and compressors used in its operations on which the Company had previously elected to apply ASU 2016-02. The office equipment and compressors are not subject to ASU 2016-02 based on the agreement and nature of use. The costs are recorded as short-term lease costs and amounts included in Oil and gas production costs. The Company terminated its Oklahoma lease as of March 31, 2021 and negotiated a reduction to its Midland office lease.

General and administrative expenses (including share-based compensation). General and administrative expenses decreased from $16,874,050 in 2020 to $16,068,105 in 2021. The decrease was primarily related to a $2,945,839 reduction in share-based compensation, offset by increases from salaries, accounting expenses, and non-recurring costs associated with investor relations.

Interest expense. Interest expense decreased from $17,617,614 in 2020 to $14,490,474 in 2021. The decrease was the result of having lower amounts outstanding on our credit facility throughout 2021.

Gain (loss) on derivative contracts. During 2020, the Company recorded a gain on derivative contracts of $21,366,068. During 2021, the Company incurred a loss on derivative contracts of $77,853,141. The significant change was due to the rise of crude oil prices during 2021, which was above the fixed price of the contracts.

Deposit forfeiture income. During 2021, the Company did not earn deposit forfeiture income. During 2020, the Company received $5,500,000 in non-refundable deposits from the intended buyer regarding the attempted divestiture of the Company’s Delaware assets. With the cancellation of that agreement, the non-refundable deposits were recognized as income on our Statements of Operations.

Benefit from (Provision for) income taxes. The benefit from (provision for) income taxes changed from a benefit of $6,001,176 for 2020 to a provision of $90,342 for 2021. The change was primarily the result of a full valuation allowance on federal taxes in 2021 with only state tax activity recognized.

Net income (loss). The Company had a net loss of ($253,411,828) in 2020 as compared to net income of $3,322,892 in 2021. The change in net income (loss) is primarily the result of the ceiling test write-down in 2020.

Year Ended December 31, 2020 Compared to Year Ended December 31, 2019

Oil and natural gas sales. Oil and natural gas sales revenue decreased from 2019 levels by approximately $82.7 million to $113.0 million in 2020. Oil sales decreased approximately $82.8 million while natural gas sales increased approximately $0.1 million. The oil sales decrease was the result of both a decrease in sales volume from 3,536,126 barrels of oil in 2019 to 2,801,528 barrels of oil in 2020 and a decrease in the average realized per barrel oil price from $54.27 in 2019 to $38.95 in 2020. These per barrel amounts are calculated by dividing revenue from oil sales by the volume of oil sold, in barrels. The reduction in oil volume was the result of shutting in production and reducing our capital development program due to oil commodity prices, which led to fewer wells drilled.

The natural gas sales volume increased slightly from 2,476,472 Mcf in 2019 to 2,494,502 Mcf in 2020 and the average realized per Mcf gas price increased from $1.54 in 2019 to $1.57 in 2020. These per Mcf amounts are calculated by dividing revenue from gas sales by the volume of gas sold, in Mcf. The slight increase was due to higher gas production volumes associated with reservoir de-pressurization at the Northwest Shelf properties.

Lease operating expenses. Our lease operating expenses (LOE) decreased from $42,213,006 in 2019 to $29,753,413 in 2020 and decreased on a BOE basis from $10.69 in 2019 to $9.25 in 2020. These per BOE amounts are calculated by dividing our total lease operating expenses by our total volume sold, in BOE. LOE decreased due to the extreme focus our operating team began early during the pandemic-induced downturn. We reduced overhead, expense repairs, and converted 29 electrical submersible pumps to rod pumps, which have an overall lower operating cost. In addition, artificial lift optimization has continued to reduce overall well failure rates, resulting in further reductions to operating costs.

46

Table of Contents

Gathering, transportation and processing costs. Our gathering, transportation and processing costs increased from $2,874,155 in 2019 to $4,090,238 in 2020. This is due to the acquisition of the Northwest Shelf in April 2019, which accounted for the lower GTP costs during the year ended December 31, 2019.

Ad valorem taxes. Our total ad valorem taxes decreased from $3,409,064 in 2019 to $3,125,222 in 2020 and increased on a BOE basis from $0.86 in 2019 to $0.97 in 2020. Ad valorem taxes decreased in total due to lower revenues and well counts year-over-year.

Oil and natural gas production taxes. Oil and natural gas production taxes as a percentage of oil and natural gas sales were 4.69% during 2019 and decreased to 4.63% in 2020. Production taxes vary from state to state. Therefore, these taxes are likely to vary in the future depending on the mix of production we generate from various states, and on the possibility that any state may raise its production tax.

Depreciation, depletion and amortization. Our depreciation, depletion and amortization expense decreased from $56,204,269 in 2019 to $43,010,660 in 2020. The decrease was the result of decreased sales volumes and a reduction in our average depreciation, depletion and amortization rate from $14.23 per BOE during 2019 to $13.37 per BOE during 2020. These per BOE amounts are calculated by dividing our total depreciation, depletion and amortization expense by our total volume sold, in BOE.

Ceiling Test Write-Down. The Company recorded a non-cash write-down of the carrying value of its proved oil and natural gas properties of $277,501,943 for the year ended December 31, 2020 as a result of ceiling test limitations, which is reflected as ceiling test impairments in the accompanying Statements of Operations. The Company did not have any write-downs for the period ended December 31, 2019. The ceiling test was calculated based upon the average of quoted market prices in effect on the first day of the month for the preceding twelve-month period as of December 31, 2019, adjusted for market differentials, per SEC guidelines. The write-down reduced earnings in the period and is expected to result in a lower depreciation, depletion and amortization rate in future periods. The primary reason for the write-down is a reduction in the oil price used for calculating the reserves from $52.19 in 2019 to $36.04 in 2020.

Asset retirement obligation accretion. Our asset retirement obligation (ARO) accretion decreased from $943,707 in 2019 to $906,616 in 2020. This was a result of the settlement of the ARO during 2020.

Operating lease expense. Our operating lease expense increased from $925,217 in 2019 to $1,196,372 in 2020 due to operating leases entered into during 2019 which had only a partial year impact, as well as additional operating leases entered into during 2020.

General and administrative expenses (including share-based compensation). General and administrative expenses decreased from $19,866,706 in 2019 to $16,874,050 in 2020. The decrease was primarily related to acquisition related expenses incurred in 2019.

Interest income. Interest income decreased from $13,511 in 2019 to $8 in 2020. The decrease was the result of lower average cash on hand during 2020.

Interest expense. Interest expense increased from $13,865,556 in 2019 to $17,617,614 in 2020. The increase was the result of having larger amounts outstanding on our credit facility during 2020.

Gain(loss) on derivative contracts. During 2019, the Company recorded a loss on derivative contracts of $3,000,078. During 2020, the Company recorded a gain on derivative contracts of $21,366,068. The change was the result of the reduction in the oil price during 2020, compared to the prices within the derivative contracts held.

Deposit forfeiture income. During 2020, the Company received $5,500,000 in non-refundable deposits from the intended buyer regarding the attempted divestiture of the Company’s Delaware assets. With the cancellation of that agreement, the non-refundable deposits were recognized as income on our Statements of Operations. No similar income item occurred during 2019.

Benefit from (Provision for) income taxes. The benefit from (provision for) income taxes changed from a provision of $13,787,654 for 2019 to a benefit of $6,001,176 for 2020. The change was primarily the result of losses due to the ceiling test write-down in 2020 offset by a valuation allowance against the deferred tax asset.

47

Table of Contents

Net income (loss). The Company had net income of $29,496,551 in 2019 compared to a net loss of ($253,411,828) in 2020. The change in net income (loss) is primarily the result of the ceiling test write-down in 2020.

Liquidity and Capital Resources

Financing of Operations. We have historically funded our operations through cash available from operations and from equity offerings of our stock. Our primary source of cash in 2021 was from funds generated from the sale of oil and natural gas production. These cash flows were primarily used to fund our capital expenditures.

Credit Facility. On July 1, 2014, the Company entered into a Credit Agreement with SunTrust Bank (now Truist), as lender, issuing bank and administrative agent for several banks and other financial institutions and lenders (the “Administrative Agent”), which was amended on June 26, 2015, July 24, 2015, May 18, 2016, and June 14, 2018. In April 2019, the Company amended and restated its Credit Agreement with the Administrative Agent (as amended and restated, the “Credit Facility”). The amendment and restatement of the Credit Facility, among other things, increased the maximum borrowing amount to $1 billion, extended the maturity date through April 2024 and made other modifications to the terms of the Credit Facility. This Credit Facility was amended on December 23, 2020 and June 17, 2020. The latest amendment adjusted the borrowing base to $350 million and made other modifications to the terms of the Credit Facility. The fourth amendment on June 10, 2021, among other things, reaffirmed the borrowing base at $350 million and modified the definition for “Fall 2020 Borrowing Base Hedges,” from 4,000 barrels of oil per day to 3,100 barrels of oil per day for calendar year 2022. The fifth amendment on June 25, 2021 incorporates contractual fallback language for US dollar LIBOR denominated syndicated loans, which language provides for the transition away from LIBOR to an alternative reference rate, and incorporates certain provisions that clarify the rights of agents to recover from lenders erroneous payments made to such lenders. The Credit Facility is secured by a first lien on substantially all of the Company’s assets.

The Borrowing Base is subject to periodic redeterminations, mandatory reductions and further adjustments from time to time. The Borrowing Base is redetermined semi-annually on each May 1 and November 1. The Borrowing Base will be reduced in certain circumstances such as the sale or disposition of certain oil and gas properties of the Company or its subsidiaries and cancellation of certain hedging positions.

The Credit Facility allows for Eurodollar Loans and Base Rate Loans (as respectively defined in the Credit Facility).  The interest rate on each Eurodollar Loan will be the adjusted LIBOR for the applicable interest period plus a margin between 2.5% and 3.5% (depending on the then-current level of Borrowing Base usage).  The annual interest rate on each Base Rate Loan is (a) the greatest of (i) the Administrative Agent’s prime lending rate, (ii) the Federal Funds Rate (as defined in the Credit Facility) plus 0.5% per annum, (iii) the adjusted LIBOR determined on a daily basis for an interest period of one-month, plus 1.00% per annum and (iv) 0.00% per annum, plus (b) a margin between 1.5% and 2.5% (depending on the then-current level of Borrowing Base usage).

The Credit Facility contains certain covenants, which, among other things, require the maintenance of (i) a total Leverage Ratio (outstanding debt to adjusted earnings before interest, taxes, depreciation and amortization) of not more than 4.0 to 1.0 and (ii) a minimum ratio of Current Assets to Current Liabilities (as such terms are defined in the Credit Facility) of 1.0 to 1.0. The December 2020 amendment permitted a total Leverage Ratio not greater than 4.25 for the period ending March 31, 2021.  The Credit Facility also contains other customary affirmative and negative covenants and events of default. As of December 31, 2021, $290,000,000 was outstanding on the Credit Facility. As of December 31, 2021, we were in compliance with all covenants contained in the Credit Facility.

Equity Offering. In October 2020, the Company closed on an underwritten public offering of 9,575,800 Common Shares, (ii) 13,428,500 Pre-Funded Warrants and (iii) 23,004,300 Common Warrants at a combined purchase price of $0.70.  This includes a partial exercise of the over-allotment. The Common Warrants have a term of five years and an exercise price of $0.80 per share. Gross proceeds totaled $16,089,582.

Concurrently with the underwritten public offering, the Company closed on a registered direct offering of (i) 3,500,000 Common Shares, (ii) 3,300,000 Pre-Funded Warrants and (iii) 6,800,000 Common Warrants at a combined purchase price of $0.70.  The Common Warrants have a term of five years and an exercise price of $0.80 per share. Gross proceeds totaled $4,756,700.

Total gross proceeds from the 2020 underwritten public offering and the registered direct offering aggregated $20,846,282.  Total net proceeds aggregated $19,383,131.

48

Table of Contents

Cash Flows. Historically, our primary sources of cash have been from operations, equity offerings and borrowings on our Credit Facility. During 2021, 2020, and 2019 we had cash inflow from operations of $72,731,212, $72,159,255, and $106,616,221, respectively. During the three years ended December 31, 2021, we financed $19,750,640 through proceeds from the sale of stock. During 2021, 2020, and 2019, we had proceeds from drawdowns on our Credit Facility of $60,150,000, $26,500,000, and $327,000,000, respectively. We primarily used this cash to fund our capital expenditures and development aggregating $528,032,951 over the three years ended December 31, 2021. Additionally, during 2021 and 2020 we used $83,150,000 and $80,000,000, respectively, to reduce the outstanding balance on our Credit Facility. As of December 31, 2021, we had cash on hand of $2,408,316 and negative working capital of $46,861,767, compared to cash on hand of $3,578,634 and negative working capital of $16,141,847 as of December 31, 2020 and cash on hand of $10,004,622 and negative working capital of $20,384,013 as of December 31, 2019.

Contractual Obligations. The Company maintains a Credit Facility which currently has a $350 million borrowing base. The outstanding balance on that Credit Facility as of December 31, 2021 is $290 million, which will require repayment or refinancing at or prior to maturity in April 2024.

The Company leases office space in The Woodlands, Texas. The Woodlands office is under a five-and-a-half-year lease beginning January 15, 2021.

The Company has financing leases for vehicles with varying maturity dates from April 2022 through August 2024.  At the end of the term of these leases, the Company will own the vehicles. Future lease payments through August 2024 aggregate $692,090.

Subsequent Events

Effective February 1, 2022, the Company entered into a derivative contract with its lender for 1,000 barrels of oil per day for the remainder of 2022 (total notional quantity of 334,000 barrels). Fixed swap prices vary by month, ranging from $90.78 per barrel in February to $80.01 per barrel by the end of the year, with a weighted average swap price of $84.61 per barrel.

Effects of Inflation and Pricing

The oil and natural gas industry is very cyclical and the demand for goods and services of oil field companies, suppliers and others associated with the industry puts extreme pressure on the economic stability and pricing structure within the industry. Typically, as prices for oil and natural gas increase, so do associated costs. Material changes in prices impact the current revenue stream, estimates of future reserves, borrowing base calculations of bank loans and the value of properties in purchase and sale transactions. Material changes in prices can impact the value of oil and natural gas companies and their ability to raise capital, borrow money and retain personnel. We anticipate business costs will vary in accordance with commodity prices for oil and natural gas, and the associated increase or decrease in demand for services related to production and exploration.

Off-Balance Sheet Financing Arrangements

As of December 31, 2021, we had no off-balance sheet financing arrangements.

Critical Accounting Policies and Estimates

Our discussion of financial condition and results of operations is based upon the information reported in our financial statements. The preparation of these statements requires us to make assumptions and estimates that affect the reported amounts of assets, liabilities, revenues and expenses as well as the disclosure of contingent assets and liabilities at the date of our financial statements. We base our assumptions and estimates on historical experience and other sources that we believe to be reasonable at the time. Actual results may vary from our estimates due to changes in circumstances, weather, politics, global economics, mechanical problems, general business conditions and other factors. Our significant accounting policies, as well as considerations of recent accounting pronouncements, are detailed in Note 1 to our financial statements included in this Annual Report. We have outlined below certain of these policies as being of particular importance to the portrayal of our financial position and results of operations and which require the application of significant judgment by our management.

Revenue Recognition. In January 2018, the Company adopted Accounting Standards Update (“ASU”) 2014-09 Revenues from Contracts with Customers (Topic 606) (“ASU 2014-09”).  The timing of recognizing revenue from the sale of produced crude oil and
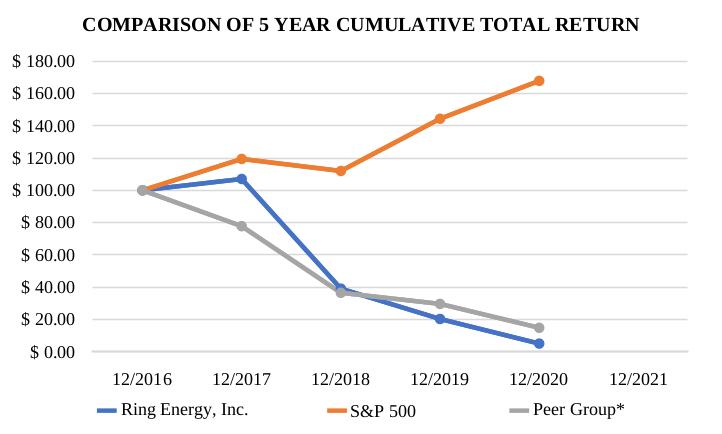
49

Table of Contents

natural gas was not changed as a result of adopting ASU 2014-09.   The Company predominantly derives its revenue from the sale of produced crude oil and natural gas. The contractual performance obligation is satisfied when the product is delivered to the customer. Revenue is recorded in the month the product is delivered to the purchaser. The Company receives payment from one to three months after delivery. The transaction price includes variable consideration as product pricing is based on published market prices and reduced for contract specified differentials. The new guidance regarding ASU 2014-09 does not require that the transaction price be fixed or stated in the contract. Estimating the variable consideration does not require significant judgment and Ring engages third party sources to validate the estimates. Revenue is recognized net of royalties due to third parties in an amount that reflects the consideration the Company expects to receive in exchange for those products. See Note 2 of our financial statements for additional information.

Full Cost Method of Accounting. We account for our oil and natural gas operations using the full cost method of accounting. Under this method, all costs (internal or external) associated with property acquisition, exploration and development of oil and gas reserves are capitalized. Costs capitalized include acquisition costs, geological and geophysical expenditures, lease rentals on undeveloped properties and cost of drilling and equipping productive and non-productive wells. Drilling costs include directly related overhead costs. All of our properties are located within the continental United States.

Write-down of Oil and Natural Gas Properties.    Companies that use the full cost method of accounting for oil and natural gas exploration and development activities are required to perform a ceiling test calculation each quarter. The full cost ceiling test is an impairment test prescribed by SEC Regulation S-X Rule 4-10. The ceiling test is performed quarterly utilizing the average of prices in effect on the first day of the month for the preceding twelve-month period in accordance with SEC Release No. 33-8995. The ceiling limits such pooled costs to the aggregate of the present value of future net revenues attributable to proved crude oil and natural gas reserves discounted at 10%, plus the lower of cost or market value of unproved properties, less any associated tax effects. If such capitalized costs exceed the ceiling, the Company will record a write-down to the extent of such excess as a non-cash charge to earnings. Any such write-down will reduce earnings in the period of occurrence and results in a lower depletion, depreciation and amortization (“DD&A”) rate in future periods. A write-down may not be reversed in future periods even though higher oil and natural gas prices may subsequently increase the ceiling.

During 2020, the Company recorded a non-cash write-down of the carrying value of the Company’s proved oil and natural gas properties as a result of a ceiling test limitation of approximately $277.5 million, which is reflected with ceiling test and other impairments in the accompanying Statements of Operations. The Company did not have any write-downs related to the full cost ceiling limitation in 2021.

Our estimates of reserves and future cash flow as of December 31, 2021 and 2020 were prepared using an average price equal to the unweighted arithmetic average of the first day of the month price for each month within the 12-month periods ended December 31, 2021 and 2020, respectively, in accordance with SEC guidelines. As of December 31, 2021, our reserves are based on an SEC average price of $63.04 per Bbl of WTI oil posted and $3.598 per MMBtu Henry Hub natural gas. As of December 31, 2020, our reserves are based on an SEC average price of $36.04 per Bbl of WTI oil posted and $1.99 per MMBtu Henry Hub natural gas. Prices are adjusted by local field and lease level differentials and are held constant for life of reserves in accordance with SEC guidelines.

Oil and Natural Gas Reserve Quantities. Reserve quantities and the related estimates of future net cash flows affect our periodic calculations of depletion and impairment of our oil and natural gas properties. Proved oil and natural gas reserves are the estimated quantities of crude oil, natural gas and natural gas liquids which geological and engineering data demonstrate with reasonable certainty to be recoverable in future periods from known reservoirs under existing economic and operating conditions. Reserve quantities and future cash flows included in this Annual Report are prepared in accordance with guidelines established by the SEC and FASB. The accuracy of our reserve estimates is a function of:

the quality and quantity of available data;
the interpretation of that data;
the accuracy of various mandated economic assumptions; and
the judgments of the persons preparing the estimates.

Our proved reserve information included in this Annual Report was prepared and determined by Cawley, Gillespie & Associates, Inc., independent petroleum engineers. Because these estimates depend on many assumptions, all of which may differ substantially from actual results, reserve estimates may be different from the quantities of oil and natural gas that are ultimately

50

Table of Contents

recovered. We continually make revisions to reserve estimates throughout the year as additional properties are acquired. We make changes to depletion rates and impairment calculations in the same period that changes to the reserve estimates are made.

All capitalized costs of oil and natural gas properties, including estimated future costs to develop proved reserves and estimated future costs of site restoration, are amortized on the unit-of-production method using estimates of proved reserves as determined by independent engineers. Investments in unproved properties and major development projects are not amortized until proved reserves associated with the projects can be determined.

Income Taxes. Deferred income taxes are provided for the difference between the tax basis of assets and liabilities and the carrying amount in our financial statements. This difference will result in taxable income or deductions in future years when the reported amount of the asset or liability is settled. Since our tax returns are filed after the financial statements are prepared, estimates are required in valuing tax assets and liabilities. We record adjustments to the actual values in the period the Company files its tax returns.

In assessing the Company’s deferred tax assets, we consider whether a valuation allowance should be recorded for some or all of the deferred tax assets which may not be realized. The ultimate realization of deferred tax assets is assessed at each reporting period and is dependent up on the generation of future taxable income and the Company’s ability to utilize operation loss carryforwards during the periods in which the temporary differences become deductible. We also consider the scheduled reversal of deferred tax liabilities and available tax planning strategies.

In January 2017, the Company adopted ASU 2016-09, Compensation – Stock Compensation (Topic 718.)  The Company used the modified retrospective method to account for unrecognized excess tax benefits from prior periods and uses the prospective method to account for current period and future excess tax benefit.

Item 7A:

Quantitative and Qualitative Disclosures About Market Risk

Commodity Price Risk

Our major market risk exposure is in the pricing applicable to our oil and natural gas production. Market risk refers to the risk of loss from adverse changes in oil and natural gas prices. Realized pricing is primarily driven by the prevailing domestic price for crude oil and spot prices applicable to the region in which we produce natural gas. Historically, prices received for oil and natural gas production have been volatile and unpredictable. We expect pricing volatility to continue.

The prices we receive depend on many factors outside of our control. Oil prices we received during 2021 ranged from a monthly average low of $52.52 per barrel to a monthly average high of $80.41 per barrel. Natural gas prices we received during 2021 ranged from a monthly average low of $3.74 per Mcf to a monthly average high of $11.19 per Mcf. A significant decline in the prices of oil or natural gas could have a material adverse effect on our financial condition and results of operations. In order to reduce commodity price uncertainty and increase cash flow predictability relating to the marketing of our crude oil and natural gas, we may enter into crude oil and natural gas price hedging arrangements with respect to a portion of our expected production.  As of December 31, 2021, the Company had in place derivative contracts covering 3,129 barrels of oil per day for the calendar year 2022. All of the 3,129 barrels of oil in 2022 are in the form of swaps of WTI Crude Oil prices. The oil swap prices for 2022 range from $44.22 to $50.05, with a weighted average swap price of $46.60. See Note 8 to our Financial Statements for further information.

Customer Credit Risk

Our principal exposure to credit risk is through receivables from the sale of our oil and natural gas production (approximately $24.0 million as of December 31, 2021). We are subject to credit risk due to the concentration of our oil and natural gas receivables with our most significant customers. We do not require our customers to post collateral, and the inability of our significant customers to meet their obligations to us or their insolvency or liquidation may adversely affect our financial results. For the fiscal year 2021, sales to three customers, Phillips 66, NGL Crude and BP Energy represented 76%, 7% and 6%, respectively, of oil and natural gas revenues. As of December 31, 2021, Phillips 66 represented 75% of our accounts receivable, NGL Crude represented 8% of our accounts receivable and BP Energy represented 4% of our accounts receivable. Due to availability of other purchasers, we do not believe the loss of any single oil or natural gas customer would have a material adverse effect on our results of operations.

51

Table of Contents

Interest Rate Risk

We are subject to market risk exposure related to changes in interest rates on our indebtedness under our Credit Facility, which bears variable interest based upon a prime rate and is therefore susceptible to interest rate fluctuations. Changes in interest rates affect the interest earned on the Company’s cash and cash equivalents and the interest rate paid on borrowings under the Credit Facility.

As of December 31, 2021, we had $290 million outstanding on our Credit Facility with a weighted average interest rate of 4.4%. A 1% change in the interest rate on our Credit Facility would result in an estimated $2,900,000 change in our annual interest expense. See note 10 in the Footnotes to the Financial Statements for more information on the Company’s interest rates on our Credit Facility.

Currently, the Company does not use interest rate derivative instruments to manage exposure to interest rate changes.

Please also see Item 1A “Risk Factors” above for a discussion of other risks and uncertainties we face in our business.

Item 8:

Financial Statements and Supplementary Data

The financial statements and supplementary data required by this item are included beginning at page F-1 of this Annual Report.

Item 9:

Changes in and Disagreements with Accountants and Accounting and Financial Disclosure

None.

Item 9A:

Controls and Procedures

Evaluation of disclosure controls and procedures.

Under the direction of our Chief Executive Officer and Chief Financial Officer, we have established disclosure controls and procedures, as defined in Rule 13a-15(e) and 15d-15(e) under the Exchange Act that are designed to ensure that information required to be disclosed by us in the reports that we file or submit under the Exchange Act is recorded, processed, summarized and reported within the time periods specified in the SEC’s rules and forms. The disclosure controls and procedures are also intended to ensure that such information is accumulated and communicated to management, including our Chief Executive Officer and Chief Financial Officer, as appropriate, to allow timely decisions regarding required disclosures. In designing and evaluating the disclosure controls and procedures, management is required to apply judgment in evaluating the benefits of possible controls and procedures relative to their costs.

As of December 31, 2021, an evaluation was performed under the supervision and with the participation of management, including our Chief Executive Officer and Chief Financial Officer, of the effectiveness of the design and operation of our disclosure controls and procedures pursuant to Rule 13a-15(b) under the Exchange Act. Based upon our evaluation, our Chief Executive Officer and Chief Financial Officer have concluded that as of December 31, 2021, our disclosure controls and procedures are effective.

Changes in internal control over financial reporting.

We regularly review our system of internal control over financial reporting and make changes to our processes and systems to improve controls and increase efficiency, while ensuring that we maintain an effective internal control environment. Changes may include such activities as implementing new, more efficient systems, consolidating activities, and migrating processes. During the first quarter of 2021, the Company transitioned its accounting and reporting functions from Tulsa in conjunction with its corporate headquarters relocation. On March 24, 2021, Travis Thomas was named Chief Financial Officer, replacing William Broaddrick.

Except as described above, there were no changes in our internal control over financial reporting that occurred during the fiscal year ended December 31, 2021 that have materially affected, or are reasonably likely to materially affect, our internal control over financial reporting.

52

Table of Contents

Management’s Annual Report on Internal Control Over Financial Reporting and Report of Independent Accounting Firm

Our management is responsible for establishing and maintaining adequate internal controls over financial reporting. Our internal control system is designed to provide reasonable assurance to our management and Board of Directors regarding the preparation and fair presentation of published financial statements.

All internal control systems, no matter how well designed, have inherent limitations. Therefore, even those systems determined to be effective can provide only reasonable assurance with respect to financial statement preparation and presentation. Furthermore, the effectiveness of a system of internal control over financial reporting in future periods can change as conditions change.

In making our assessment of internal control over financial reporting, our management used the criteria issued by the Committee of Sponsoring Organizations of the Treadway Commission (COSO) in Internal Control – Integrated Framework (2013). Based on our assessment, we believe that, as of December 31, 2021, our internal control over financial reporting is effective based on those criteria.

The independent registered public accounting firm, Grant Thornton LLP, has audited the financial statements included in this Annual Report on Form 10-K, and has issued their report on the effectiveness of the Company’s internal control over financial reporting at December 31, 2021. The report, which expresses an unqualified opinion on the effectiveness of the Company’s internal control over financial reporting at December 31, 2021, is set forth below.

53

Table of Contents

REPORT OF INDEPENDENT REGISTERED PUBLIC ACCOUNTING FIRM

Board of Directors and Stockholders

Ring Energy, Inc.

Opinion on internal control over financial reporting

We have audited the internal control over financial reporting of Ring Energy, Inc. (a Nevada corporation) (the “Company”) as of December 31, 2021, based on criteria established in the 2013 Internal Control—Integrated Framework issued by the Committee of Sponsoring Organizations of the Treadway Commission (“COSO”). In our opinion, the Company maintained, in all material respects, effective internal control over financial reporting as of December 31, 2021, based on criteria established in the 2013 Internal Control—Integrated Framework issued by COSO.

We also have audited, in accordance with the standards of the Public Company Accounting Oversight Board (United States) (“PCAOB”), the financial statements of the Company as of and for the year ended December 31, 2021, and our report dated March 16, 2022 expressed an unqualified opinion on those financial statements.

Basis for opinion

The Company’s management is responsible for maintaining effective internal control over financial reporting and for its assessment of the effectiveness of internal control over financial reporting, included in the accompanying Management’s Annual Report on Internal Control Over Financial Reporting. Our responsibility is to express an opinion on the Company’s internal control over financial reporting based on our audit. We are a public accounting firm registered with the PCAOB and are required to be independent with respect to the Company in accordance with the U.S. federal securities laws and the applicable rules and regulations of the Securities and Exchange Commission and the PCAOB.

We conducted our audit in accordance with the standards of the PCAOB. Those standards require that we plan and perform the audit to obtain reasonable assurance about whether effective internal control over financial reporting was maintained in all material respects. Our audit included obtaining an understanding of internal control over financial reporting, assessing the risk that a material weakness exists, testing and evaluating the design and operating effectiveness of internal control based on the assessed risk, and performing such other procedures as we considered necessary in the circumstances. We believe that our audit provides a reasonable basis for our opinion.

Definition and limitations of internal control over financial reporting

A company’s internal control over financial reporting is a process designed to provide reasonable assurance regarding the reliability of financial reporting and the preparation of financial statements for external purposes in accordance with generally accepted accounting principles. A company’s internal control over financial reporting includes those policies and procedures that (1) pertain to the maintenance of records that, in reasonable detail, accurately and fairly reflect the transactions and dispositions of the assets of the company; (2) provide reasonable assurance that transactions are recorded as necessary to permit preparation of financial statements in accordance with generally accepted accounting principles, and that receipts and expenditures of the company are being made only in accordance with authorizations of management and directors of the company; and (3) provide reasonable assurance regarding prevention or timely detection of unauthorized acquisition, use, or disposition of the company’s assets that could have a material effect on the financial statements.

Because of its inherent limitations, internal control over financial reporting may not prevent or detect misstatements. Also, projections of any evaluation of effectiveness to future periods are subject to the risk that controls may become inadequate because of changes in conditions, or that the degree of compliance with the policies or procedures may deteriorate.

/s/ GRANT THORNTON LLP

Houston, Texas

March 16, 2022

54

Table of Contents

Item 9B:

Other Information

None.

Item 9C:

Disclosure Regarding Foreign Jurisdictions that Prevent Inspections

None.

PART III

Item 10:

Directors, Executive Officers and Corporate Governance

The information required by this item is incorporated by reference herein from the 2022 Proxy Statement to be filed with the SEC no later than 120 days after December 31, 2021. If the Proxy Statement is not filed with the SEC by such time, such information will be included in an amendment to this Annual Report by such time.

Item 11:

Executive Compensation

The information required by this item is incorporated by reference herein from the 2022 Proxy Statement to be filed with the SEC no later than 120 days after December 31, 2021. If the Proxy Statement is not filed with the SEC by such time, such information will be included in an amendment to this Annual Report by such time.

Item 12:

Security Ownership of Certain Beneficial Owners and Management and Related Stockholder Matters

The information required by this item is incorporated by reference herein from the 2022 Proxy Statement to be filed with the SEC no later than 120 days after December 31, 2021. If the Proxy Statement is not filed with the SEC by such time, such information will be included in an amendment to this Annual Report by such time.

Item 13:

Certain Relationships and Related Transactions, and Director Independence

The information required by this item is incorporated by reference herein from the 2022 Proxy Statement to be filed with the SEC no later than 120 days after December 31, 2021. If the Proxy Statement is not filed with the SEC by such time, such information will be included in an amendment to this Annual Report by such time.

Item 14:

Principal Accounting Fees and Services

The information required by this item is incorporated by reference herein from the 2022 Proxy Statement to be filed with the SEC no later than 120 days after December 31, 2021. If the Proxy Statement is not filed with the SEC by such time, such information will be included in an amendment to this Annual Report by such time.

55

Table of Contents

PART IV

Item 15:

Exhibits, Financial Statement Schedules

(a)Financial Statements

The following financial statements are filed with this Annual Report:

Page

Report of Grant Thornton, LLP, Independent Registered Public Accounting Firm (PCAOB ID Number 248)

F-5


Report of Eide Bailly LLP, Independent Registered Public Accounting Firm (PCAOB ID Number 286)

F-8

Balance Sheets as of December 31, 2021 and 2020

F-9


Statements of Operations for the years ended December 31, 2021, 2020, and 2019

F-10


Statements of Stockholders’ Equity for the years ended December 31, 2021, 2020, and 2019

F-11


Statements of Cash Flows for the years ended December 31, 2021, 2020, and 2019

F-12


Notes to Financial Statements

F-14


Supplemental Information on Oil and Gas Producing Activities

F-33

56

Table of Contents


Incorporated by Reference

Exhibit
Number

Exhibit Description

Form

File No.

Exhibit

Filing Date

Filed
Here-with

2.1

Purchase and Sale Agreement, dated February 25, 2019 by and among Ring Energy, Inc. and Wishbone Energy Partners, LLC, Wishbone Texas operating Company LLC and WB WaterWorks, LLC

8-K

001-36057

2.1

2/28/19

3.1

Articles of Incorporation (as amended)

10-K

000-53920

3.1

4/1/13

3.1(a)

Certificate of Amendment to the Articles of Incorporation, as amended, of Ring Energy, Inc.

8-K

001-36057

3.1

12/17/21

3.2

Bylaws of Ring Energy, Inc. as amended April 13, 2021

8-K

001-36057

3.1

4/15/21

4.1

Registration Rights Agreement, dated April 9, 2019 by and between Ring Energy, Inc. and Wishbone Energy Partners, LLC

10-Q

001-36057

4.1

4/12/19

4.2

Description of Ring Energy, Inc. equity securities registered under Section 12(b) of the Securities Exchange Act of 1934, as amended

10-K

X

4.3

Securities Purchase Agreement, dated October 27, 2020

8-K

001-36057

4.1

10/29/20

10.1

Executive Employment and Severance Agreement, dated as of September 30, 2020, by and between the Company and Stephen D. Brooks

8-K

001-36957

10.1

12/4/20

10.2

Executive Employment and Severance Agreement, dated as of September 30, 2020, by and between the Company and Paul D. McKinney

8-K

001-36957

10.1

10/6/20

10.3

Employment and Severance Agreement, dated as of September 30, 2020, by and between the Company and Alexander Dyes

8-K

001-36057

10.1

12/22/20

10.4

Employment and Severance Agreement, dated as of September 30, 2020, by and between the Company and Marinos C. Baghdati

8-K

001-36057

10.2

12/22/20

10.5*

Ring Energy Inc. Long Term Incentive Plan, as Amended

8-K

000-53920

99.3

1/24/13

10.6*

Form of Option Grant for Long-Term Incentive Plan

10-Q

000-53920

10.2

8/14/12

10.7

Credit Agreement dated July 1, 2014 with SunTrust Bank

8-K

001-36057

10.1

7/3/14

10.8

First Amendment to Credit Agreement with SunTrust Bank

8-K

001-36057

10.1

6/29/15

10.9

Second Amendment to Credit Agreement with SunTrust Bank

8-K

001-36057

10.1

7/29/15

10.10

Third Amendment to Credit Agreement with SunTrust Bank

8-K

001-36057

10.1

5/20/16

10.11

Fourth Amendment to Credit Agreement with SunTrust Bank

10-K

001-36057

10.16

3/16/21

10.12

Fifth Amendment to Credit Agreement with SunTrust

8-K

001-36057

10.1

6/19/18

10.13

Amended and Restated Credit Agreement with SunTrust Bank

10-Q

001-36057

10.2

5/8/19

10.14

First Amendment to Amended and Restated Credit Agreement with SunTrust Bank

8-K

001-36057

10.1

12/9/19

10.15

Second Amendment to Amended and Restated Credit Agreement, dated June 17, 2020, by and among Ring Energy, Inc., the lenders party thereto, and Truist Bank, as administrative agent for the lenders and as issuing bank

8-K

001-36057

10.1

6/19/20

10.16

Third Amendment to Amended and Restated Credit Agreement with Truist Bank

8-K

001-36057

10.1

12/29/20

57

Table of Contents

10.17

Fourth Amendment to Amended and Restated Credit Agreement with Truist Bank dated June 10, 2021

8-K

001-36057

10.1

6/16/21

10.18

Fifth Amendment to Amended and Restated Credit Agreement with Truist Bank dated June 25, 2021

8-K

001-36057

10.1

6/25/21

10.19

Executive Employment and Severance Agreement, dated as of October 26, 2020, by and between the Company and Travis T. Thomas

8-K

001-36057

10.1

3/26/21

10.20

Commitment Letter dated February 24, 2019, between Ring Energy, Inc., SunTrust Bank and SunTrust Robinson Humphrey, Inc.

8-K

001-36057

2.1

2/28/19

14.1

Code of Ethics

8-K

000-53920

14.1

1/24/13

23.1

Consent of Cawley, Gillespie & Associates, Inc.

X

23.2

Consent of Grant Thornton LLP

X

23.3

Consent of Eide Bailly LLP

X

31.1

Rule 13a-14(a) Certification by Chief Executive Officer

X

31.2

Rule 13a-14(a) Certification by Chief Financial Officer

X

32.1

Section 1350 Certification of Chief Executive Officer

X

32.2

Section 1350 Certification Chief Financial Officer

X

99.1

Reserve Report of Cawley, Gillespie & Associates, Inc.

X

101.INS

Inline XBRL Instance Document

X

101.SCH

Inline XBRL Taxonomy Extension Schema Document

X

101.CAL

Inline XBRL Taxonomy Extension Calculation Linkbase Document

X

101.DEF

Inline XBRL Taxonomy Extension Definition Linkbase Document

X

101.LAB

Inline XBRL Taxonomy Extension Label Linkbase Document

X

101.PRE

Inline XBRL Taxonomy Extension Presentation Linkbase Document

X

104

Cover Page Interactive Data File (formatted as Inline XBRL and contained in Exhibit 101).

*

Management contract

58

Table of Contents

SIGNATURES

In accordance with Section 13 or 15(d) of the Exchange Act, the registrant caused this report to be signed on behalf by the undersigned, thereunto duly authorized.

Ring Energy, Inc.


By:

/s/ Paul D. McKinney

Mr. Paul D. McKinney

Chief Executive Officer


Date: March 16, 2022

KNOW ALL PERSONS BY THESE PRESENTS, that each individual whose signature appears below constitutes and appoints Paul D. McKinney, his or her true and lawful attorneys-in-fact and agents, with full power of substitution and resubstitution, for him or her and in his or her name, place and stead, in any and all capacities, to sign any and all amendments to the annual report on Form 10-K filed with the Securities and Exchange Commission, hereby ratifying and confirming his signature as he may be signed by his or her said attorney to any and all amendments to said Annual Report on Form 10-K.

Pursuant to the requirements of the Securities Exchange Act of 1934, this report has been signed below by the following persons on behalf of the Registrant and in the capacities indicated on the dates indicated.

/s/ Paul D. McKinney

/s/ Thomas L. Mitchell

Mr. Paul D. McKinney

Mr. Thomas L. Mitchell

Chief Executive Officer and Director

Director

(Principal Executive Officer)

Date: March 16, 2022

Date: March 16, 2022


/s/ Travis T. Thomas

/s/ Anthony B. Petrelli

Mr. Travis T. Thomas

Mr. Anthony B. Petrelli

Chief Financial Officer

Director

(Principal Financial Officer)

Date: March 16, 2022

Date: March 16, 2022


/s/ Regina Roesener

/s/ Clayton E. Woodrum

Mrs. Regina Roesener

Mr. Clayton E. Woodrum

Director

Director


Date: March 16, 2022

Date: March 16, 2022

/s/ Richard Harris

/s/ John Crum

Mr. Richard Harris

Mr. John Crum

Director

Director

Date: March 16, 2022

Date: March 16, 2022

59

Table of Contents

RING ENERGY, INC.

INDEX TO FINANCIAL STATEMENTS


Page


Report of Grant Thornton, LLP, Independent Registered Public Accounting Firm (PCAOB ID Number 248)

F-5

Report of Eide Bailly LLP, Independent Registered Public Accounting Firm (PCAOB ID Number 286)

F-8


Balance Sheets as of December 31, 2021 and 2020

F-9


Statements of Operations for the years ended December 31, 2021, 2020, and 2019

F-10


Statements of Stockholders’ Equity for the years ended December 31, 2021, 2020, and 2019

F-11


Statements of Cash Flows for the years ended December 31, 2021, 2020, and 2019

F-12


Notes to Financial Statements

F-14


Supplemental Information on Oil and Natural Gas Producing Activities

F-33

F-1

Table of Contents

REPORT OF INDEPENDENT REGISTERED PUBLIC ACCOUNTING FIRM

Board of Directors and Stockholders

Ring Energy, Inc.

Opinion on the financial statements

We have audited the accompanying balance sheet of Ring Energy, Inc. (a Nevada corporation) (the “Company”) as of December 31, 2021, the related statements of operations, stockholders’ equity, and cash flows for the year ended December 31, 2021, and the related notes (collectively referred to as the “financial statements”). In our opinion, the financial statements present fairly, in all material respects, the financial position of the Company as of December 31, 2021, and the results of its operations and its cash flows for the year ended December 31, 2021, in conformity with accounting principles generally accepted in the United States of America.

We also have audited, in accordance with the standards of the Public Company Accounting Oversight Board (United States) (“PCAOB”), the Company’s internal control over financial reporting as of December 31, 2021, based on criteria established in the 2013 Internal Control—Integrated Framework issued by the Committee of Sponsoring Organizations of the Treadway Commission (“COSO”), and our report dated March 16, 2022 expressed an unqualified opinion.

Basis for opinion

These financial statements are the responsibility of the Company’s management. Our responsibility is to express an opinion on the Company’s financial statements based on our audit. We are a public accounting firm registered with the PCAOB and are required to be independent with respect to the Company in accordance with the U.S. federal securities laws and the applicable rules and regulations of the Securities and Exchange Commission and the PCAOB.

We conducted our audit in accordance with the standards of the PCAOB. Those standards require that we plan and perform the audit to obtain reasonable assurance about whether the financial statements are free of material misstatement, whether due to error or fraud. Our audit included performing procedures to assess the risks of material misstatement of the financial statements, whether due to error or fraud, and performing procedures that respond to those risks. Such procedures included examining, on a test basis, evidence regarding the amounts and disclosures in the financial statements. Our audit also included evaluating the accounting principles used and significant estimates made by management, as well as evaluating the overall presentation of the financial statements. We believe that our audit provides a reasonable basis for our opinion.

Critical audit matters

The critical audit matters communicated below are matters arising from the current period audit of the financial statements that were communicated or required to be communicated to the audit committee and that: (1) relate to accounts or disclosures that are material to the financial statements and (2) involved our especially challenging, subjective, or complex judgments. The communication of critical audit matters does not alter in any way our opinion on the financial statements, taken as a whole, and we are not, by communicating the critical audit matters below, providing separate opinions on the critical audit matters or on the accounts or disclosures to which they relate.

The development of estimated proved reserves used in the calculation of depletion, depreciation and amortization expense and evaluation of full cost ceiling impairment under the full cost method of accounting

As described further in Note 1 to the financial statements, the Company accounts for its oil and gas properties using the full cost method of accounting which requires management to make estimates of proved reserve volumes and future net revenues to record depletion, depreciation and amortization expense and assess its oil and gas properties for potential full cost ceiling impairment. To estimate the volume of proved reserves and future net revenue, management makes significant estimates and assumptions including forecasting the production decline rate of producing properties and forecasting the timing and volume of production associated with the Company’s development plan for proved undeveloped properties. In addition, the estimation of proved reserves is also impacted by management’s judgments and estimates regarding the financial performance of wells associated with proved reserves to determine if wells are expected with reasonable certainty to be economical under the appropriate pricing assumptions required in the estimation of depletion,

F-2

Table of Contents

depreciation and amortization expense and potential full cost ceiling impairment assessment. We identified the estimation of proved reserves of oil and gas properties as a critical audit matter.

The principal consideration for our determination that the estimation of proved reserves is a critical audit matter is that changes in certain inputs and assumptions, which require a high degree of subjectivity, necessary to estimate the volume and future net revenues of the Company’s proved reserves could have a significant impact on the measurement of depletion, depreciation and amortization expense and potential full cost ceiling impairment. In turn, auditing those inputs and assumptions required subjective and complex auditor judgment.

Our audit procedures related to the estimation of proved reserves included the following, among others.

We tested the design and operating effectiveness of controls relating to management’s estimation of proved reserves for the purpose of estimating depletion, depreciation and amortization expense and assessing the Company’s oil and gas properties for potential full cost ceiling impairment.
We evaluated the independence, objectivity, and professional qualifications of the Company’s reserve engineers, made inquiries of those specialists regarding the process followed and judgments made to estimate the Company’s proved reserve volumes, and read the reserve report prepared by the Company’s specialists.

F-3

Table of Contents

To the extent key inputs and assumptions used to determine proved reserve volumes and other cash flow inputs and assumptions are derived from the Company’s accounting records, including, but not limited to: historical pricing differentials, operating costs, estimated capital costs, and ownership interests, we tested management’s process for determining the assumptions, including examining the underlying support on a sample basis. Specifically, our audit procedures involved testing management’s assumptions by performing the following:
oWe compared the estimated pricing differentials used in the reserve report to prices realized by the Company related to revenue transactions recorded in the current year and examined contractual support for the pricing differentials
oWe tested models used to estimate the future operating costs in the reserve report and compared amounts to historical operating costs
oWe evaluated the method used to determine the estimated future development costs used in the reserve report and compared management’s estimates to amounts expended for recently drilled and completed wells
oWe tested the working and net revenue interests used in the reserve report by inspecting land and division order records;
oWe evaluated evidence supporting the amount of proved undeveloped properties reflected in the reserve report by examining historical conversion rates and support for the Company’s ability to fund and intent to develop the proved undeveloped properties; and
oWe applied analytical procedures to production forecasts in the reserve report by comparing to historical actual results.

/s/ GRANT THORNTON LLP

We have served as the Company’s auditor since 2021.

Houston, Texas

March 16, 2022

F-4

Table of Contents

Report of Independent Registered Public Accounting Firm

To the Board of Directors and

Stockholders of Ring Energy, Inc.

The Woodlands, Texas

Opinions on the Financial Statements and Internal Control Over Financial Reporting

We have audited the accompanying balance sheet of Ring Energy, Inc. (Ring Energy) as of December 31, 2020, and the related statements of operations, stockholders’ equity, and cash flows for the years ended December 31, 2020 and 2019, and the related notes (collectively referred to as the “financial statements”).  In our opinion, the financial statements present fairly, in all material respects, the financial position of Ring Energy as of December 31, 2020, and the results of its operations and its cash flows for the years ended December 31, 2020 and 2019, in conformity with accounting principles generally accepted in the United States of America.

We also have audited Ring Energy’s internal control over financial reporting as of December 31, 2020, based on criteria established in 2013 Internal Control—Integrated Framework issued by the Committee of Sponsoring Organizations of the Treadway Commission (COSO). In our opinion, Ring Energy maintained, in all material respects, effective internal control over financial reporting as of December 31, 2020, based on criteria established in 2013 Internal Control—Integrated Framework issued by COSO.

Basis for Opinion

Ring Energy’s management is responsible for these financial statements, for maintaining effective internal control over financial reporting, and for its assessment of the effectiveness of internal control over financial reporting, included in the accompanying Management’s Annual Report on Internal Control Over Financial Reporting appearing under Item 9A. Our responsibility is to express an opinion on the entity’s financial statements and an opinion on the entity’s internal control over financial reporting based on our audits. We are a public accounting firm registered with the Public Company Accounting Oversight Board (United States) (“PCAOB”) and are required to be independent with respect to Ring Energy in accordance with the U.S. federal securities laws and the applicable rules and regulations of the Securities and Exchange Commission and the PCAOB.

We conducted our audits in accordance with the standards of the PCAOB. Those standards require that we plan and perform the audits to obtain reasonable assurance about whether the financial statements are free of material misstatement, whether due to error or fraud, and whether effective internal control over financial reporting was maintained in all material respects.

Our audits of the financial statements included performing procedures to assess the risks of material misstatement of the financial statements, whether due to error or fraud, and performing procedures that respond to those risks. Such procedures included examining, on a test basis, evidence regarding the amounts and disclosures in the financial statements. Our audits also included evaluating the accounting principles used and significant estimates made by management, as well as evaluating the overall presentation of the financial statements. Our audit of internal control over financial reporting included obtaining an understanding of internal control over financial reporting, assessing the risk that a material weakness exists, and testing and evaluating the design and operating effectiveness of internal control based on the assessed risk. Our audits also included performing such other procedures as we considered necessary in the circumstances. We believe that our audits provide a reasonable basis for our opinions.

F-5

Table of Contents

Definition and Limitations of Internal Control Over Financial Reporting

An entity’s internal control over financial reporting is a process designed to provide reasonable assurance regarding the reliability of financial reporting and the preparation of financial statements for external purposes in accordance with accounting principles generally accepted in the United States of America. An entity’s internal control over financial reporting includes those policies and procedures that (1) pertain to the maintenance of records that, in reasonable detail, accurately and fairly reflect the transactions and dispositions of the assets of the entity; (2) provide reasonable assurance that transactions are recorded as necessary to permit preparation of financial statements in accordance with generally accepted accounting principles, and that receipts and expenditures of the entity are being made only in accordance with authorizations of management and directors of the entity; and (3) provide reasonable assurance regarding prevention or timely detection of unauthorized acquisition, use, or disposition of the entity’s assets that could have a material effect on the financial statements.

Because of its inherent limitations, internal control over financial reporting may not prevent or detect misstatements. Also, projections of any evaluation of effectiveness to future periods are subject to the risk that controls may become inadequate because of changes in conditions, or that the degree of compliance with the policies or procedures may deteriorate.

Critical Audit Matters

The critical audit matters communicated below are matters arising from the current period audit of the financial statements that were communicated or required to be communicated to the audit committee that (1) relate to accounts or disclosures that are material to the financial statements and (2) involve our especially challenging, subjective, or complex judgement. The communication of critical audit matters does not alter in any way our opinion on the financial statements, taken as a whole, and we are not, by communicating the critical audit matters below, providing separate opinions on the critical audit matters or on the accounts or disclosures to which they relate.

Depletion expense and ceiling test calculation of oil and natural gas properties impacted by the estimation of proved oil and natural gas reserves

As described further in Note 1 to the financial statements, the Company uses the full cost method of accounting for oil and natural gas properties. This accounting method requires management to make estimates of proved oil and natural gas reserves and related future cash flows to compute and record depreciation, depletion and amortization expense, as well as to assess potential impairment of oil and natural gas properties (the full cost ceiling test). To estimate the volume of proved oil and natural gas reserves quantities, management makes significant estimates and assumptions including forecasting the production decline rate of producing properties and forecasting the timing and volume of production associated with the Company’s development plan for proved undeveloped properties. In addition, the estimation of proved oil and natural gas reserves is also impacted by management’s judgements and estimates regarding the financial performance of wells associated with those proved oil and natural gas reserves to determine if wells are expected to be economical under the appropriate pricing assumptions that are required in the estimation of depreciation, depletion and amortization expense and potential ceiling test impairment assessments. We identified the estimation of proved oil and natural gas reserves as it relates to the recognition of depreciation, depletion and amortization expense and the assessment of potential impairment as a critical audit matter.

The principal consideration for our determination that the estimation of proved oil and natural gas reserves is a critical audit matter is that there is significant judgement by management and use of specialist in developing the estimates of proved oil and natural gas reserves and a relatively minor change in certain inputs and assumptions that are necessary to estimate the volume and future cash flows of the Company’s proved oil and natural gas reserves could have a significant impact on the measurement of depreciation, depletion and amortization expense and/or impairment expense. In turn, auditing those inputs and assumptions required subjective and complex auditor judgement.

Our audit procedures related to the estimation of proved oil and natural gas reserves included the following, among others.

We tested the design and operating effectiveness of internal controls relating to management’s estimation of proved oil and natural gas reserves for the purpose of estimating depreciation, depletion and amortization expense and assessing for ceiling test impairment.
We evaluated the independence, objectivity, and professional qualifications of the Company’s independent petroleum engineer specialist and read the report prepared by the Company’s independent petroleum engineer specialist.

F-6

Table of Contents

We evaluated the sensitive inputs and assumptions used to determine proved reserve volumes and other cash flow inputs and assumptions that are derived from the Company’s accounting records, such as historical pricing differentials, operating costs, estimated capital costs, and ownership interests. We tested management’s process for determining the assumptions, including the underlying support, on a sample basis where applicable. Specifically, our audit procedures involved testing management’s assumptions as follows:
oTested the working and net revenue interest used in the reserve report
oTested the model used to determine the future capital expenditures by comparing estimated future capital expenditures used in the reserve report to amounts expended for recently drilled and completed wells, where applicable;
oCompared the estimated pricing differentials used in the reserve report to realized prices related to revenue transactions recorded in the current year;
oTested the model used to estimate the operating costs at year end and compared to historical operating costs;
oEvaluated the Company’s evidence supporting the proved undeveloped properties reflected in the reserve report by examining historical conversion rates and support for the Company’s ability to fund and intent to develop the proved undeveloped properties.

F-7

Table of Contents

Graphic

Valuation Allowance of Deferred Tax Assets

As described in Note 1 to the financial statements, the Company records a valuation allowance to reduce total net deferred tax assets when a judgement is made that is considered more likely than not that a tax benefit will not be realized. The ultimate realization of deferred tax assets is dependent upon the generation of future taxable income during the periods in which those temporary differences will become deductible. We identified the realizability of deferred tax assets as a critical audit matter.

The principal considerations for our determination that the realizability of deferred tax assets is a critical audit matter are that (a) the forecast of future taxable income is subject to a high level of estimation and (b) the determination of any limitations on the utilization of net operating loss carryforwards involve complex calculations and judgement. There is inherent uncertainty and subjectivity related to management’s judgements and assumptions regarding the Company’s future taxable income, which are complex in nature and require significant auditor judgment.

Our audit procedures related to the valuation of deferred tax assets included the following, among others.

We tested the effectiveness of controls over management’s estimate of the realization of the deferred tax assets and management’s tax planning strategies and the determination of whether it is more likely than not that the deferred tax assets will be realized prior to expiration.
We tested the reasonableness of management’s corporate model used to estimate future taxable income by comparing the estimates to the following:
oHistorical taxable income.
oEvidence obtained in other areas of the audit.
oManagement’s history of carrying out its stated plans and its ability to carry out its plans.

We have served as Ring Energy’s auditor since 2013.

Graphic

Denver, Colorado

March 16, 2021

F-8

Table of Contents

RING ENERGY, INC.

BALANCE SHEETS

As of December 31,


2021


2020

ASSETS


Current Assets


Cash and cash equivalents

$

2,408,316

$

3,578,634

Accounts receivable

24,026,807

14,997,979

Joint interest billing receivable

2,433,811

1,327,262

Derivative receivable

499,906

Prepaid expenses and retainers

938,029

396,109

Total Current Assets


29,806,963


20,799,890

Properties and Equipment


Oil and natural gas properties, full cost method


883,844,745


836,514,815

Financing lease asset subject to depreciation

1,422,487

858,513

Fixed assets subject to depreciation


2,089,722


1,520,890

Total Properties and Equipment

887,356,954

838,894,218

Accumulated depreciation, depletion and amortization


(235,997,307)


(200,111,658)

Net Properties and Equipment


651,359,647


638,782,560

Operating lease asset

1,277,253

1,494,399

Deferred financing costs


1,713,466


2,379,348

Total Assets

$

684,157,329

$

663,456,197

LIABILITIES AND STOCKHOLDERS’ EQUITY


Current Liabilities


Accounts payable

$

46,233,452

$

32,500,081

Financing lease liability

316,514

295,311

Operating lease liability

290,766

859,017

Derivative liabilities

29,241,588

3,287,328

Notes Payable

586,410

Total Current Liabilities


76,668,730


36,941,737

Noncurrent Liabilities

Deferred income taxes

90,292

Revolving line of credit


290,000,000


313,000,000

Financing lease liability, less current portion

343,727

126,857

Operating lease liability, less current portion

1,138,319

635,382

Derivative liabilities

869,273

Asset retirement obligations


15,292,054


17,117,135

Total Liabilities


383,533,122


368,690,384

Stockholders' Equity


Preferred stock - $0.001 par value; 50,000,000 shares authorized; no shares issued or outstanding


Common stock - $0.001 par value; 225,000,000 shares authorized; 100,192,562 shares and 85,868,287 shares issued and outstanding, respectively


100,193


85,568

Additional paid-in capital


553,472,292


550,951,415

Accumulated deficit


(252,948,278)


(256,271,170)

Total Stockholders’ Equity


300,624,207


294,765,813

Total Liabilities and Stockholders' Equity

$

684,157,329

$

663,456,197

The accompanying notes are an integral part of these financial statements.

F-9

Table of Contents

RING ENERGY, INC.

STATEMENTS OF OPERATIONS

For the years ended December 31, 


2021


2020


2019

Oil and Natural Gas Revenues

$

196,305,966

$

113,025,138

$

195,702,831

Costs and Operating Expenses


Lease operating expenses


30,312,399


29,753,413


42,213,006

Gathering, transportation and processing costs

4,333,232

4,090,238

2,874,155

Ad valorem taxes


2,276,463


3,125,222


3,409,064

Oil and natural gas production taxes


9,123,420


5,228,090


9,130,379

Depreciation, depletion and amortization


37,167,967


43,010,660


56,204,269

Ceiling test impairment

277,501,943

Asset retirement obligation accretion


744,045


906,616


943,707

Operating lease expense

523,487

1,196,372

925,217

General and administrative expense


16,068,105


16,874,050


19,866,706

Total Costs and Operating Expenses


100,549,118


381,686,604


135,566,503

Income (Loss) from Operations


95,756,848


(268,661,466)


60,136,328

Other Income (Expense)


Interest income


1


8


13,511

Interest (expense)


(14,490,474)


(17,617,614)


(13,865,556)

Gain (loss) on derivative contracts


(77,853,141)


21,366,068


(3,000,078)

Deposit forfeiture income


5,500,000


Net Other Income (Expense)


(92,343,614)


9,248,462


(16,852,123)

Income (Loss) Before Provision for Income Taxes

3,413,234

(259,413,004)

43,284,205

Benefit from (Provision for) Income Taxes


(90,342)


6,001,176


(13,787,654)

Net Income (Loss)

$

3,322,892

$

(253,411,828)

$

29,496,551

Basic Earnings (Loss) per share

$

0.03

$

(3.48)

$

0.44

Diluted Earnings (Loss) per share

$

0.03

$

(3.48)

$

0.44

The accompanying notes are an integral part of these financial statements.

F-10

Table of Contents

RING ENERGY, INC.

STATEMENTS OF STOCKHOLDERS’ EQUITY

Additional

Retained Earnings

Total

Common Stock

Paid-in

(Accumulated

Stockholders'


Shares


Amount


Capital


Deficit)


Equity

Balance, December 31, 2018


63,229,710

$

63,230

$

494,892,093

$

(32,355,893)

$

462,599,430

Common stock issued as partial consideration in acquisition


4,576,951


4,577


28,326,750


28,331,327

Restricted stock vested

187,136


187


(187)


Share-based compensation


3,082,625


3,082,625

Net income


29,496,551


29,496,551

Balance, December 31, 2019


67,993,797

$

67,994

$

526,301,281

$

(2,859,342)

$

523,509,933

Return of common stock issued as
consideration in asset acquisition

(16,702)


(17)


(103,368)


(103,385)

Common stock and warrants issued for cash, net

13,075,800


13,076


19,366,756


19,379,832

Exercise of pre-funded warrants issued in offering

3,300,000


3,300


3,300

Common stock issued for services

35,000


35


23,765


23,800

Restricted stock vested

1,180,392

1,180

(1,180)

Share-based compensation

5,364,162

5,364,162

Net (loss)

(253,411,828)

(253,411,828)

Balance, December 31, 2020

85,568,287

$

85,568

$

550,951,415

$

(256,271,170)

$

294,765,813

Common stock and warrants issued for cash, net

$

$

(65,000)

$

(65,000)

Exercise of pre-funded warrants issued in offering

13,428,500


13,429


13,429

Exercise of common warrants issued in offering

442,600

443

353,637

354,080

Options exercised

100,000


100


199,900


200,000

Restricted stock vested

785,357


785


(785)


Shares to cover tax withholdings

(132,182)

(132)

132

Payments to cover tax withholdings

(385,330)

(385,330)

Share-based compensation

2,418,323

2,418,323

Net income (loss)


3,322,892


3,322,892

Balance, December 31, 2021

100,192,562

$

100,193

$

553,472,292

$

(252,948,278)

$

300,624,207

The accompanying notes are an integral part of these financial statements.

F-11

Table of Contents

RING ENERGY, INC.

STATEMENTS OF CASH FLOWS

For the Years Ended December 31, 


2021


2020


2019

Cash Flows From Operating Activities


Net income (loss)

$

3,322,892

$

(253,411,828)

$

29,496,551

Adjustments to reconcile net income (loss) to net cash provided by operating activities:


Depreciation, depletion and amortization


37,167,967


43,010,660


56,204,269

Ceiling test impairment


277,501,943


Asset retirement obligation accretion


744,045


906,616


943,707

Amortization of deferred financing costs

665,882

1,190,109

991,310

Share-based compensation


2,418,323


5,364,162


3,082,625

Shares issued for services

23,800

Deferred income tax expense (benefit)


265,479


(3,975,170)


9,500,517

Excess tax expense (benefit) related to share-based compensation


(175,187)


(2,026,006)


3,855,389

Adjustment to deferred tax asset for change in effective tax rate


431,748

(Gain) loss on derivative contracts


77,853,141


(21,366,068)


2,937,024

Cash received (paid) for derivative settlements, net

(52,768,154)

22,522,591

63,054

Changes in assets and liabilities:


Accounts receivable


(9,483,639)


7,896,517


(10,035,648)

Prepaid expenses and retainers


(541,920)


3,586,146


(1,878,667)

Accounts payable


15,449,215


(8,380,594)


12,320,308

Settlement of asset retirement obligation


(2,186,832)


(683,623)


(1,295,966)

Net Cash Provided by Operating Activities


72,731,212


72,159,255


106,616,221

Cash Flows From Investing Activities


Payments for the Wishbone Acquisition

(276,061,594)

Payments to purchase oil and natural gas properties


(1,368,437)


(1,317,313)


(3,400,411)

Proceeds from divestiture of oil and natural gas properties

2,000,000

8,547,074

Payments to develop oil and natural gas properties

(51,302,131)

(42,457,745)

(152,125,320)

Payments to acquire or improve fixed assets subject to depreciation


(568,832)


(55,339)


Net Cash (Used in) Investing Activities


(51,239,400)


(43,830,397)


(423,040,251)

Cash Flows From Financing Activities


Proceeds from revolving line of credit


60,150,000


26,500,000


327,000,000

Payments on revolving line of credit

(83,150,000)

(80,000,000)

Proceeds from issuance of common stock and warrants


367,509


19,383,131


Proceeds from option exercise

200,000

Payments for taxes withheld on vested restricted shares

(385,330)

Proceeds from notes payable


1,297,718


Payments on notes payable

(711,308)

Payment of deferred financing costs

(104,818)

(355,049)

(3,781,657)

Reduction of financing lease liabilities


(325,901)


(282,928)


(153,417)

Net Cash (Used in) Financing Activities


(22,662,130)


(34,754,846)


323,064,926

Net Increase (Decrease) in Cash


(1,170,318)


(6,425,988)


6,640,896

Cash at Beginning of Period


3,578,634


10,004,622


3,363,726

Cash at End of Period

$

2,408,316

$

3,578,634

$

10,004,622

Supplemental Cash Flow Information


Cash paid for interest

$

14,110,421

$

16,911,344

$

10,364,313

The accompanying notes are an integral part of these financial statements.

F-12

Table of Contents

RING ENERGY, INC.

STATEMENTS OF CASH FLOWS (CONTINUED)

For the Years Ended December 31, 


2021

2020

2019

Noncash Investing and Financing Activities

Asset retirement obligation incurred during development

$

171,390


$

99,436


$

631,727

Asset retirement obligation acquired

662,705

39,701

Asset retirement obligation revision of estimate

435,419

34,441

Asset retirement obligation sold

(2,934,126)

Operating lease assets obtained in exchange for new operating lease liability

839,536

823,727

2,319,185

Operating lease asset revision

(621,636)

Financing lease assets obtained in exchange for new financing lease liability

858,513

Prepaid asset settled in divestiture of oil and natural gas properties


1,019,876

Oil and gas assets and properties acquired through stock issuance


Stock issued in property acquisition returned in final settlement

103,385

Capitalized expenditures attributable to drilling projects financed through current liabilities

309,365

1,415,073

15,170,000

Supplemental Schedule of Investing Activities Wishbone Acquisition

Assumption of joint interest billing receivable


1,464,394

Assumption of prepaid assets


2,864,554

Assumption of accounts and revenue payables


(1,234,861)

Asset retirement obligation incurred through acquisition


(3,705,941)

Common stock issued as partial consideration in acquisition


(28,331,327)

Oil and gas properties subject to amortization


305,004,775

Cash paid


276,061,594

The accompanying notes are an integral part of these financial statements.

F-13

Table of Contents

RING ENERGY, INC.

NOTES TO FINANCIAL STATEMENTS

NOTE 1 – ORGANIZATION, BASIS OF PRESENTATION AND SUMMARY OF SIGNIFICANT ACCOUNTING POLICIES

Organization and Nature of Operations – Ring Energy, Inc., a Nevada corporation (“Ring,” “Ring Energy,” the “Company,” “we,” “us,” “our,” or similar terms), is a growth oriented independent exploration and production company based in The Woodlands, Texas and is engaged in oil and natural gas development, production, acquisition, and exploration activities currently focused in Texas and New Mexico. Our primary drilling operations target the oil and liquids rich producing formations in the Northwest Shelf, the Central Basin Platform, and the Delaware Basin all of which are part of the Permian Basin in Texas and New Mexico.

Reclassifications – Certain prior period amounts relating to components of operating expense have been reclassified to conform to current year presentation within “Costs and Operating Expenses” in the Statements of Operations. Additionally, certain prior amounts associated with realized and unrealized gains (losses) have been reclassified within the Statements of Operations and Statements of Cash Flows to conform with current year presentation.

Use of Estimates – The preparation of financial statements in conformity with accounting principles generally accepted in the United States of America (“GAAP”) requires management to make estimates and assumptions that affect the reported amounts of assets and liabilities, disclosure of contingent assets and liabilities and the reported amounts of revenues and expenses during the reporting period. Actual results could differ from those estimates. Changes in the future estimated oil and natural gas reserves or the estimated future cash flows attributable to the reserves that are utilized for impairment analysis could have a significant impact on the future results of operations.

Fair Value Measurements - Fair value is the price that would be received to sell an asset or paid to transfer a liability in an orderly transaction between market participants at the measurement date (exit price). The Financial Accounting Standards Board (“FASB”) has established a fair value hierarchy that prioritizes the inputs to valuation techniques used to measure fair value. This hierarchy consists of three broad levels. Level 1 inputs are the highest priority and consist of unadjusted quoted prices in active markets for identical assets and liabilities. Level 2 are inputs other than quoted prices that are observable for the asset or liability, either directly or indirectly. Level 3 are unobservable inputs for an asset or liability.

Fair Values of Financial Instruments – The carrying amounts reported for the revolving line of credit approximates fair value because the underlying instruments are at interest rates which approximate current market rates. The carrying amounts of receivables and accounts payable and other current assets and liabilities approximate fair value because of the short-term maturities and/or liquid nature of these assets and liabilities.

Fair Value of Non-financial Assets and Liabilities – The Company also applies fair value accounting guidance to initially, or as events dictate, measure non-financial assets and liabilities such as those obtained through business acquisitions, property and equipment and asset retirement obligations. These assets and liabilities are subject to fair value adjustments only in certain circumstances and are not subject to recurring revaluations. Fair value may be estimated using comparable market data, a discounted cash flow method, or a combination of the two as considered appropriate based on the circumstances. Under the discounted cash flow method, estimated future cash flows are based on management’s expectations for the future and include estimates of future oil and natural gas production or other applicable sales estimates, operational costs and a risk-adjusted discount rate. The Company may use the present value of estimated future cash inflows and/or outflows or third-party offers or prices of comparable assets with consideration of current market conditions to value its non-financial assets and liabilities when circumstances dictate determining fair value is necessary. Given the significance of the unobservable nature of a number of the inputs, these are considered Level 3 on the fair value hierarchy.

Concentration of Credit Risk and Accounts Receivable – Financial instruments that potentially subject the Company to a concentration of credit risk consist principally of cash and accounts receivable. The Company has cash in excess of federally insured limits of $1,936,805 and $3,328,634 as of December 31, 2021 and 2020, respectively. The Company places its cash with a high credit quality financial institution. The Company has not experienced any losses in such accounts and believes it is not exposed to significant credit risk in this area.

Substantially all of the Company’s accounts receivable is from purchasers of oil and natural gas. Oil and natural gas sales are generally unsecured. The Company has not had any significant credit losses in the past and believes its accounts receivable are fully collectable. The Company also has a joint interest billing receivable. Joint interest billing receivables are collateralized by the pro

F-14

Table of Contents

rata revenue attributable to the joint interest holders and further by the interest itself. Accordingly, no material credit losses have been provided as of December 31, 2021 and 2020.

Cash and Cash Equivalents – The Company considers all highly liquid investments purchased with an original maturity of three months or less to be cash equivalents.

Oil and Natural Gas Properties – The Company uses the full cost method of accounting for oil and natural gas properties. Under this method, all costs (direct and indirect) associated with acquisition, exploration, and development of oil and natural gas properties are capitalized. Costs capitalized include acquisition costs, geological and geophysical expenditures, lease rentals on undeveloped properties and costs of drilling and equipping productive and non-productive wells. Drilling costs include directly related overhead costs. Capitalized costs are categorized either as being subject to amortization or not subject to amortization.

The Company records a liability in the period in which an asset retirement obligation (“ARO”) is incurred, in an amount equal to the discounted estimated fair value of the obligation that is capitalized. Thereafter this liability is accreted up to the final retirement cost. An ARO is a future expenditure related to the disposal or other retirement of certain assets. The Company’s ARO relates to future plugging and abandonment expenses of its oil and natural gas properties and related facilities disposal.

All capitalized costs of oil and natural gas properties, including the estimated future costs to develop proved reserves and estimated future costs to plug and abandon wells and costs of site restoration, less the estimated salvage value of equipment associated with the oil and natural gas properties, are amortized on the unit-of-production method using estimates of proved reserves as determined by independent petroleum engineers. If the results of an assessment indicate that the properties are impaired, the amount of the impairment is offset to the capitalized costs to be amortized. The following table shows total depletion and the depletion per barrel-of-oil-equivalent rate, for the years ended December 31, 2021, 2020, and 2019.

For the Years Ended December 31, 


2021


2020


2019

Depletion

$

36,735,070

$

42,634,294

$

55,870,246

Depletion rate, per barrel-of-oil-equivalent (BOE)

$

11.82

$

13.25

$

14.15

In addition, capitalized costs less accumulated depreciation, depletion and amortization and related deferred income taxes shall not exceed an amount (the full cost ceiling) equal to the sum of:

1)the present value of estimated future net revenues discounted ten percent computed in compliance with SEC guidelines;
2)plus the cost of properties not being amortized;
3)plus the lower of cost or estimated fair value of unproven properties included in the costs being amortized;
4)less income tax effects related to differences between the book and tax basis of the properties.

For the year ended December 31, 2020, the Company recognized an impairment on oil and natural gas properties as a result of the ceiling test in the amount of $277,501,943. No impairment was recorded for the years ended December 31, 2021 or 2019.

Land, Buildings, Equipment and Leasehold Improvements – Land, buildings, equipment and leasehold improvements are carried at historical cost, adjusted for impairment loss and accumulated depreciation. Historical costs include all direct costs associated with the acquisition of land, buildings, equipment and leasehold improvements and placing them in service.

Depreciation of buildings, equipment , software and leasehold improvements is calculated using the straight-line method based upon the following estimated useful lives:

Leasehold improvements


310 years

Office equipment and software


37 years

Equipment


510 years

Depreciation expense was $432,897, $376,366, and 334,023 for the years ended December 31, 2021, 2020, and 2019, respectively.

F-15

Table of Contents

Notes Payable During 2021, the Company obtained external insurance for directors and officers, control of well, and cybersecurity through signing three promissory notes. As of December 31, 2021, our notes payable balance included within current liabilities on our balance sheet is $586,410.

Revenue Recognition – In January 2018, the Company adopted Accounting Standards Update (“ASU”) 2014-09 Revenues from Contracts with Customers (Topic 606) (“ASU 2014-09”). The timing of recognizing revenue from the sale of produced crude oil and natural gas was not changed as a result of adopting ASU 2014-09. The Company predominantly derives its revenue from the sale of produced crude oil and natural gas. The contractual performance obligation is satisfied when the product is delivered to the customer. Revenue is recorded in the month the product is delivered to the purchaser. The Company receives payment from one to three months after delivery. The transaction price includes variable consideration as product pricing is based on published market prices and reduced for contract specified differentials. The new guidance regarding ASU 2014-09 does not require that the transaction price be fixed or stated in the contract. Estimating the variable consideration does not require significant judgment and Ring engages third party sources to validate the estimates. Revenue is recognized net of royalties due to third parties in an amount that reflects the consideration the Company expects to receive in exchange for those products. See Note 2 for additional information.

Income Taxes – Provisions for income taxes are based on taxes payable or refundable for the current year and deferred taxes. Deferred taxes are provided on differences between the tax basis of assets and liabilities and their reported amounts in the financial statements, and tax carryforwards. Deferred tax assets and liabilities are included in the financial statements at currently enacted income tax rates applicable to the period in which the deferred tax assets and liabilities are expected to be realized or settled. As changes in tax laws or rates are enacted, deferred tax assets and liabilities are adjusted through the provision for income taxes.

In January 2017, the Company adopted ASU 2016-09, Compensation – Stock Compensation (Topic 718.) The Company used the modified retrospective method to account for unrecognized excess tax benefits from prior periods and uses the prospective method to account for current period and future excess tax benefit.

Accounting for Uncertainty in Income Taxes – In accordance with generally accepted accounting principles, the Company has analyzed its filing positions in all jurisdictions where it is required to file income tax returns for the open tax years in such jurisdictions. The Company has identified its federal income tax return and its franchise tax return in Texas in which it operates as “major” tax jurisdictions. The Company’s federal income tax returns for the years ended December 31, 2017 through 2021 remain subject to examination. The Company’s federal income tax returns for the years ended December 31, 2007 through 2021 remain subject to examination to the extent of the net operating loss (NOL) carryforwards. The Company’s franchise tax returns in Texas remain subject to examination for 2016 through 2021. The Company currently believes that all significant filing positions are highly certain and that all of its significant income tax filing positions and deductions would be sustained upon audit. Therefore, the Company has no significant reserves for uncertain tax positions and no adjustments to such reserves were required by generally accepted accounting principles. No interest or penalties have been levied against the Company and none are anticipated; therefore, no interest or penalty has been included in our provision for income taxes in the statements of operations.

Earnings (Loss) Per Share – Basic earnings (loss) per share is computed by dividing net income (loss) by the weighted-average number of common shares outstanding during the year. Diluted earnings (loss) per share are calculated to give effect to potentially issuable dilutive common shares.

Major Customers – During the year ended December 31, 2021, sales to three customers represented 76%, 7% and 6%, respectively, of total oil and natural gas sales. As of December 31, 2021, sales outstanding from these three customers represented 75%, 8% and 4%, respectively, of accounts receivable. During the year ended December 31, 2020, sales to three customers represented 68%, 10% and 8%, respectively, of total oil and natural gas sales. As of December 31, 2020, sales outstanding from these three customers represented 80%, 0% and 5%, respectively, of accounts receivable. During the year ended December 31, 2019, sales to three customers represented 42%, 36% and 7%, respectively, of total oil and natural gas sales. As of December 31, 2019, sales outstanding from these three customers represented 47%, 31% and 9%, respectively, of accounts receivable.

Share-Based Employee Compensation – The Company has outstanding stock option grants and restricted stock awards to directors, officers and employees, which are described more fully in Note 13. The Company recognizes the cost of employee services received in exchange for an award of equity instruments based on the grant-date fair value of the award and recognizes the related compensation expense over the period during which an employee is required to provide service in exchange for the award, which is generally the vesting period. 

Share-Based Compensation to Non-Employees – The Company accounts for share-based compensation issued to non-employees as either the fair value of the consideration received or the fair value of the equity instruments issued, whichever is more reliably

F-16

Table of Contents

measurable. The measurement date for these issuances is the earlier of (i) the date at which a commitment for performance by the recipient to earn the equity instruments is reached or (ii) the date at which the recipient’s performance is complete.

Share-based compensation incurred for the years ended December 31, 2021, 2020, and 2019 was $2,418,323, $5,364,162, and $3,082,625, respectively.

Derivative Instruments and Hedging Activities – The Company may periodically enter into derivative contracts to manage its exposure to commodity risk. These derivative contracts, which are generally placed with major financial institutions, may take the form of forward contracts, futures contracts, swaps, or options. The oil and gas reference prices upon which the commodity derivative contracts are based reflect various market indices that have a high degree of historical correlation with actual prices received by the Company for its oil and natural gas production.

When applicable, the Company records all derivative instruments, other than those that meet the normal purchases and sales exception, on the balance sheet as either an asset or liability measured at fair value. Changes in fair value are recognized currently in earnings unless specific hedge accounting criteria are met. Refer to Note 8 for further details.

Recently Adopted Accounting Pronouncements – In August 2018, the FASB issued ASU 2018-13, Fair Value Measurement (Topic 820): Changes to the Disclosure Requirements for Fair Value Measurement (“ASU 2018-13”).  ASU 2018-13 eliminates, adds and modifies certain disclosure requirements for fair value measurement. ASU 2018-13 is effective for annual and interim periods beginning January 1, 2020, with early adoption permitted for either the entire standard or only the provisions that eliminate or modify requirements. ASU 2018-13 requires that the additional disclosure requirements be adopted using a retrospective approach. The adoption of this guidance did not have a material impact on the Company’s financial statements.

Effective January 1, 2019, the Company adopted ASU 2016-02, Leases (Topic 842). The purpose of this guidance is to increase transparency and comparability among organizations by recognizing certain lease assets and lease liabilities on the balance sheet and disclosing key information about leasing arrangements. See Note 3 for a discussion of the impact on the Company’s financial statements.

In June 2016, the FASB issued ASU No. 2016-13, Financial Instruments-Credit Losses (Topic 326): Measurement of Credit Losses on Financial Instruments, followed by other related ASUs that provided targeted improvements (collectively “ASU 2016-13”). ASU 2016-13 provides financial statement users with more decision-useful information about the expected credit losses on financial instruments and other commitments to extend credit held by a reporting entity at each reporting date. The guidance is to be applied using a modified retrospective method and is effective for fiscal years beginning after December 15, 2019, with early adoption permitted. The Company adopted ASU 2016-13 on January 1, 2020. The adoption of ASU 2016-13 did not have a material impact to the Company’s consolidated financial statements or disclosures.

In December 2019, the FASB released ASU No. 2019-12 (“ASU 2019-12”), Income Taxes (Topic 740) – Simplifying the Accounting for Income Taxes, which removes certain exceptions for recognizing deferred taxes for investments, performing intraperiod allocation and calculating income taxes in interim periods. The ASU also adds guidance to reduce complexity in certain areas, including recognizing deferred taxes for tax goodwill and allocating taxes to members of a consolidated group. The amended standard is effective for fiscal years beginning after December 15, 2020. The adoption of ASU 2019-12 did not have a material impact to the Company’s financial statements or disclosures. In October 2020, the FASB issued ASU 2020-10, Codification Improvements, which clarifies or improves disclosure requirements for various topics to align with SEC regulations. This update was effective for the Company beginning in the first quarter of 2021 and is being applied retrospectively. The adoption and implementation of this ASU did not have a material impact on the Company’s financial statements.

Recent Accounting Pronouncements In March 2020, the FASB issued ASU 2020-04, Reference Rate Reform (Topic 848): Facilitation of the Effects of Reference Rate Reform on Financial Reporting (“ASU 2020-04”), which provides optional expedients and exceptions for applying GAAP to contract modifications and hedging relationships, subject to meeting certain criteria, that reference LIBOR or another rate that is expected to be discontinued. ASU 2020-04 will be in effect through December 31, 2022.  In January 2021, issued ASU No. 2021-01, Reference Rate Reform (Topic 848): Scope (“ASU 2021-01”), to provide clarifying guidance regarding the scope of Topic 848. ASU 2020-04 was issued to provide optional guidance for a limited period of time to ease the potential burden in accounting for (or recognizing the effects of) reference rate reform on financial reporting. The Company is currently assessing the impact of adopting this new guidance.

In August 2020, the FASB issued ASU No. 2020-06, Debt - Debt with Conversion and Other Options (Subtopic 470-20) and Derivatives and Hedging - Contracts in Entity’s Own Equity (Subtopic 815-40) (“ASU 2020-06”). ASU 2020-06 was issued to reduce the complexity associated with accounting for certain financial instruments with characteristics of liabilities and equity. The

F-17

Table of Contents

guidance is to be applied using either a modified retrospective or a fully retrospective method. ASU 2020-06 is effective for fiscal years beginning after December 15, 2021, with early adoption permitted. The Company will adopt ASU 2020-06 effective January 1, 2022. The adoption of ASU 2020-06 is not expected to have a material impact on the Company’s consolidated financial statements or disclosures.

In October 2021, the FASB issued ASU 2021-08, "Business Combinations (Topic 805) – Accounting for Contract Assets and Contract Liabilities from Contracts with Customers.” This update requires the acquirer in a business combination to record contract asset and liabilities following Topic 606 – “Revenue from Contracts with Customers” at acquisition as if it had originated the contract, rather than at fair value. This update is effective for public business entities beginning after December 15, 2022, with early adoption permitted. The Company continues to evaluate the provisions of this update, but it does not believe the adoption will have a material impact on its financial position, results of operations or liquidity.

NOTE 2 – REVENUE RECOGNITION

Oil sales

Under the Company’s oil sales contracts, the Company sells oil production at the point of delivery and collects an agreed upon index price, net of pricing differentials. The Company recognizes revenue when control transfers to the purchaser at the point of delivery at the net price received.

Natural gas sales

Under the Company’s natural gas sales processing contracts for our Central Basin Platform properties, Delaware Basin properties and part of our Northwest Shelf assets, the Company delivers unprocessed natural gas to a midstream processing entity at the wellhead. The midstream processing entity obtains control of the natural gas at the wellhead. The midstream processing entity gathers and processes the natural gas and remits proceeds to the Company for the resulting sale of natural gas. Under these processing agreements, the Company recognizes revenue when control transfers to the purchaser at the point of delivery. As such, the Company accounts for any fees and deductions as a reduction of the transaction price.

Under the Company natural gas sales processing contracts for the bulk of our Northwest Shelf assets, the Company delivers unprocessed natural gas to a midstream processing entity at the wellhead. However, the Company maintains ownership of the gas through processing and receives proceeds from the marketing of the resulting products. Under this processing agreement, the Company recognizes the fees associated with the processing as an expense rather than netting these costs against revenue.

Disaggregation of Revenue. The following table presents revenues disaggregated by product:

For the years ended December 31,


2021


2020


2019

Operating revenues


Oil

$

181,533,093

$

109,113,557

$

191,891,314

Natural gas

14,772,873

3,911,581

3,811,517

Total operating revenues

$

196,305,966

$

113,025,138

$

195,702,831

NOTE 3 – LEASES

Effective January 1, 2019, the Company adopted ASU 2016-02, Leases (Topic 842).  This guidance attempts to increase transparency and comparability among organizations by recognizing certain lease assets and lease liabilities on the balance sheet and disclosing key information about leasing arrangements. The main difference between previous GAAP methodology and the method in this new guidance is the recognition on the balance sheet of certain lease assets and lease liabilities by lessees for those leases that were classified as operating leases under previous GAAP.

The Company made accounting policy elections to not capitalize leases with a lease term of twelve months or less and to not separate lease and non-lease components for all asset classes. The Company has also elected to adopt the package of practical expedients within ASU 2016-02 that allows an entity to not reassess prior to the effective date (i) whether any expired or existing contracts are or contain leases, (ii) the lease classification for any expired or existing leases, or (iii) initial direct costs for any existing leases and the practical expedient regarding land easements that exist prior to the adoption of ASU 2016-02. The Company did not elect the practical expedient of hindsight when determining the lease term of existing contracts at the effective date.

F-18

Table of Contents

The Company has operating leases for our offices in Midland, Texas and The Woodlands, Texas. The Midland office is under a five-year lease which began January 1, 2021.  Also beginning January 15, 2021, the Company entered into a five-and-a-half-year sub-lease for office space in The Woodlands, Texas. The future payments associated with these operating leases are reflected below. During the years ended December 31, 2019 and 2020 the Company had an operating lease with Arenaco, LLC for its Tulsa, Oklahoma office. The Tulsa lease was terminated as of March 31, 2021, with payments made until the end of February 2021. Refer to Note 14 for further details.

The Company also has month to month leases for office equipment and compressors used in our operations on which the Company has elected to apply ASU 2016-02 (i.e not capitalize).  The office equipment and compressors are not subject to ASU 2016-02 based on the agreement and nature of use.

These leases are for terms that are less than 12 months and the Company does not intend to continue to lease this equipment for more than 12 months. The lease costs associated with these leases is reflected in the short-term lease costs within Lease operating expenses, shown below.

The Company also has financing leases for vehicles. These leases have a term of 36 months at the end of which the Company owns the vehicles. These vehicles are generally sold at the end of their term and the proceeds applied to a new vehicle.

Future lease payments associated with these operating and financing leases as of December 31, 2021 are as follows:


2022


2023


2024


2025


2026

Operating lease payments (1)

$

349,127

$

356,991

$

376,855

$

384,719

$

110,096

Financing lease payments (2)

336,206

213,530

142,354

(1)

The weighted average discount rate as of December 31, 2021 for operating leases was 4.50%. Based on this rate, the future lease payments above include imputed interest of $148,701. The weighted average remaining term of operating leases was 4.3 years.

(2)

The weighted average discount rate as of December 31, 2021 for financing leases was 4.22%. Based on this rate, the future lease payments above include imputed interest of $31,850. The weighted average remaining term of financing leases was 2.23 years.

The following table provides supplemental information regarding cash flows from operations:

2021

Operating lease costs

$

523,487

Short term lease costs (1)

$

4,161,540

Financing lease costs:

Amortization of financing lease assets (2)

$

307,936

Interest on lease liabilities (3)

$

22,088

(1)

Amount included in Lease operating expenses

(2)

Amount included in Depreciation, depletion and amortization

(3)

Amount included in Interest expense

NOTE 4 – EARNINGS (LOSS) PER SHARE INFORMATION

F-19

Table of Contents


For the years ended December 31, 


2021


2020


2019

Net Income (Loss)

$

3,322,892

$

(253,411,828)

$

29,496,551

Basic Weighted-Average Shares Outstanding


99,387,028


72,891,310


66,571,738

Effect of dilutive securities:


Stock options


75,897


174,944

Restricted stock


1,613,810


10,346

Common warrants

20,116,440

Diluted Weighted-Average Shares Outstanding


121,193,175


72,891,310


66,757,028

Basic Earnings (Loss) per Share

$

0.03

$

(3.48)

$

0.44

Diluted Earnings (Loss) per Share

$

0.03

$

(3.48)

$

0.44

Stock options to purchase 113,659, 465,500, and 2,353,500 shares of common stock were excluded from the computation of diluted earnings per share during the years ended December 31, 2021, 2020 and 2019, respectively, as their effect would have been anti-dilutive. Also excluded from the computation of diluted earnings per share were 114,880  (including 94,270 shares related to the performance stock units further described in Note 13), 2,144,617, and 704,684 shares of unvested restricted stock during the year ended December 31, 2021, 2020 and 2019, respectively, as their effect would have been anti-dilutive. Common warrants to purchase 29,804,300 shares of common stock were excluded from the computation of diluted earnings per share during the year ended December 31, 2020, as their effect would have been anti-dilutive.

Pre-funded warrants to purchase 13,428,500 shares of common stock were included in the calculation of the Basic Weighted-Average Shares Outstanding for the year ended December 31, 2020 as they were exercisable for a nominal amount and so were treated as if they were exercised at issuance. These shares were exercised in January 2021 and have also been included in the beginning shares outstanding for the calculation of Basic Weighted-Average Shares Outstanding for the year ended December 31, 2021.

NOTE 5 – ACQUISITIONS & DIVESTITURES

On April 9, 2019, the Company completed the acquisition of oil and gas properties from Wishbone Energy Partners, LLC, Wishbone Texas Operating Company LLC and WB WaterWorks LLC (collectively, “Wishbone”) on the Northwest Shelf in Gaines, Yoakum, Runnels and Coke Counties, Texas and Lea County, New Mexico (the “Acquisition”) pursuant to a purchase and sale agreement dated as of February 25, 2019 by and among the Company and Wishbone (the “Purchase and Sale Agreement”). The acquired properties consist of 49,754 gross (38,230 net) acres and include a 77% average working interest and a 58% average net revenue interest. Ring executed the Acquisition for the existing production and future development potential. The Company incurred approximately $4.1 million in acquisition related costs, which were recognized in general and administrative expense. Total consideration after purchase price adjustments included cash payments totaling approximately $276.1 million and the issuance of 4,576,951 shares of common stock, of which 2,538,071 shares were placed in escrow to satisfy potential indemnification claims. The shares held in escrow were released in April of 2020. The shares were valued at the price on the date of the signing of the Purchase and Sale Agreement, February 25, 2019, of $6.19 per share.

The Acquisition was recognized as a business combination whereby Ring recorded the assets acquired and the liabilities assumed at their fair values as of February 1, 2019, which is the date the Company obtained control of the properties and was the acquisition date for financial reporting purposes. The Company determined that it had effective control of the properties effective February 1, 2019 based on Ring having primary decision making ability regarding the properties beginning at that time. Revenues and related expenses for the Acquisition are included in our statements of operations beginning February 1, 2019. The estimated fair value of the acquired properties approximated the consideration paid, which the Company concluded approximated the fair value that would be paid by a typical market participant. The following table summarizes the fair values of the assets acquired and the liabilities assumed:

F-20

Table of Contents

Assets acquired:


Proved oil and natural gas properties

$

305,004,775

Joint interest billing receivable

1,464,394

Prepaid assets

2,864,554

Liabilities assumed

Accounts and revenues payable

(1,234,861)

Asset retirement obligations

(3,705,941)

Total Identifiable Net Assets

$

304,392,921

The revenues and direct operating costs associated with the acquired properties included in our financial statements for the year ended December 31, 2019 are as follows:

Revenue


$

105,102,038

Oil and natural gas production costs


17,037,228

Oil and natural gas production taxes


4,646,660

Total direct costs (1)


21,683,888

Earnings from the Acquired properties

$

83,418,150

(1)This includes only oil and natural gas production costs and oil and natural gas production taxes and does not give account to depreciation, depletion and amortization, accretion of asset retirement obligation, general and administrative expense, interest expense or any other cost that cannot be directly correlated to the Acquisition.

The Company entered into a Purchase, Sale and Exchange Agreement dated February 1, 2021, effective January 1, 2021, with an unrelated party, covering the sale and exchange of certain oil and gas interests in Andrews County, Texas. Upon the sale and transfer of wells and leases between the two parties, the Company received a cash consideration of $2,000,000 and reduced the Company’s asset retirement obligations by $2,934,126 for the properties sold and added $662,705 of asset retirement obligations for the wells acquired.

NOTE 6 – DEPOSIT FORFEITURE INCOME

In the second quarter of 2020, the Company entered into an agreement with an intended buyer to sell the Company’s Delaware Basin assets. The agreement was amended on six different occasions throughout 2020 releasing the initial deposits to the Company and requiring additional non-refundable deposits. In total, $5,500,000 in non-refundable deposits were made to the Company. In October 2020, the agreement was terminated as the buyer was not able to consummate the transaction. As such, the Company recognized the $5,500,000 as income in our Statements of Operations as no divestiture of assets had occurred. Refer to Note 17 for further details.

NOTE 7 – OIL AND NATURAL GAS PRODUCING ACTIVITIES

Set forth below is certain information regarding the aggregate capitalized costs of oil and natural gas properties and costs incurred by the Company for its oil and natural gas property acquisitions, development and exploration activities:

Net Capitalized Costs

As of December 31, 


2021


2020

Oil and natural gas properties, full cost method

$

883,844,745

$

836,514,815

Financing lease asset subject to depreciation

1,422,487

858,513

Fixed assets subject to depreciation


2,089,722


1,520,890

Total Properties and Equipment


887,356,954


838,894,218

Accumulated depletion, depreciation and amortization


(235,997,307)


(200,111,658)

Net Properties and Equipment

$

651,359,647

$

638,782,560

F-21

Table of Contents

Net Costs Incurred in Oil and Gas Producing Activities

For the years Ended December 31, 


2021


2020

Payments to purchase oil and natural gas properties

$

1,368,437

$

1,317,313

Proceeds from divestiture of oil and natural gas properties

(2,000,000)

Payments to develop oil and natural gas properties

51,302,131

42,457,745

Payments to acquire or improve fixed assets subject to depreciation

568,832

55,339

Total Net Costs Incurred

$

51,239,400

$

43,830,397

NOTE 8 – DERIVATIVE FINANCIAL INSTRUMENTS

The Company is exposed to fluctuations in crude oil and natural gas prices on its production. We can utilize derivative strategies that consist of either a single derivative instrument or a combination of instruments to manage the variability in cash flows associated with the forecasted sale of our future domestic oil and natural gas production. While the use of derivative instruments may limit or partially reduce the downside risk of adverse commodity price movements, their use also may limit future income from favorable commodity price movements.

From time to time the Company enters into derivative contracts to protect the Company’s cash flow from price fluctuation and maintain its capital programs. The Company has historically used either costless collars or swaps for this purpose. Oil derivative contracts are based on WTI Crude Oil prices and natural gas contacts are based on Henry Hub. A “costless collar” is the combination of two options, a put option (floor) and call option (ceiling) with the options structured so that the premium paid for the put option will be offset by the premium received from selling the call option. Similar to costless collars, there is no cost to enter into the swap contracts. On swap contracts, there is no spread and payments will be made or received based on the difference between WTI and the swap contract price.

Throughout 2020 and 2021, the Company entered into additional derivative contracts in the form of oil swaps for 2022. The following tables reflect the details of those contracts:

Oil derivative contracts


Barrels 


Date entered into


Period covered


per day


Swap price

2022 swaps


12/4/2020


Calendar year 2022


500

$

44.22

12/7/2020


Calendar year 2022


500

44.75

12/10/2020

Calendar year 2022

500

44.97

12/17/2020


Calendar year 2022


250

45.98

1/4/2021

Calendar year 2022


250

47.00

2/4/2021

Calendar year 2022

250

50.05

5/11/2021


Calendar year 2022


879 (1)

49.03

(1)The notional quantity per the swap contract entered into on May 11, 2021 is for 26,750 barrels of oil per month. The 879 represents the daily amount on an annual basis.

We did not designate our derivative instruments as hedges for accounting purposes. Derivative financial instruments are recorded at fair value and included as either assets or liabilities in the accompanying balance sheets. Any gains or losses resulting from changes in fair value of outstanding derivative financial instruments and from the settlement of derivative financial instruments are recognized in earnings and included as a component of other income in the accompanying statements of operations.

The following presents the impact of the Company’s contracts on its balance sheets for the periods indicated.


As of December 31,


2021


2020

Liabilities


Commodity derivative instruments

$

29,241,588

$

3,287,328

Derivative liabilities, current

$

29,241,588

$

3,287,328

F-22

Table of Contents

Commodity derivative instruments

$

$

869,273

Derivative liabilities, non-current

$

$

869,273

The components of “Gain (loss) on derivative contracts” are as follows for the respective periods:


For the years ended December 31,


2021


2020


2019

Gain (loss) on oil derivative

$

(77,654,452)

$

20,357,812

$

(3,000,078)

Gain (loss) on natural gas derivatives


(198,689)


1,008,256


Gain (loss) on derivative contracts

$

(77,853,141)

$

21,366,068

$

(3,000,078)

The components of “Cash (paid) received for derivative settlements, net” are as follows for the respective periods:


For the years ended December 31,


2021


2020


2019

Cash flows from operating activities


Cash (paid) received on oil derivatives

$

(53,511,332)

$

22,522,591

$

63,054

Cash (paid) received on natural gas derivatives


743,178


Cash (paid) received from derivative settlements

$

(52,768,154)

$

22,522,591

$

63,054

The use of derivative transactions involves the risk that the counterparties, which generally are financial institutions, will be unable to meet the financial terms of such transactions. All derivative contracts have been with lenders under our credit facility.

NOTE 9 – FAIR VALUE MEASUREMENTS

Fair value is the price that would be received to sell an asset or paid to transfer a liability in an orderly transaction between market participants at the measurement date (exit price). The authoritative guidance requires disclosure of the framework for measuring fair value and requires that fair value measurements be classified and disclosed in one of the following categories:

Level 1:

Unadjusted quoted prices in active markets that are accessible at the measurement date for identical, unrestricted assets or liabilities. We consider active markets as those in which transactions for the assets or liabilities occur with sufficient frequency and volume to provide pricing information on an ongoing basis.

Level 2:

Quoted prices in markets that are not active, or inputs that are observable, either directly or indirectly, for substantially the full term of the asset or liability. This category includes those derivative instruments that we value using observable market data. Substantially all of these inputs are observable in the marketplace throughout the full term of the derivative instrument, can be derived from observable data or are supported by observable levels at which transactions are executed in the marketplace.

Level 3:

Measured based on prices or valuation models that require inputs that are both significant to the fair value measurement and less observable from objective sources (i.e., supported by little or no market activity).

Financial assets and liabilities are classified based on the lowest level of input that is significant to the fair value measurement. Our assessment of the significance of a particular input to the fair value measurement requires judgment and may affect the valuation of the fair value of assets and liabilities and their placement within the fair value hierarchy. We continue to evaluate our inputs to ensure the fair value level classification is appropriate. When transfers between levels occur, it is our policy to assume that the transfer occurred at the date of the event or change in circumstances that caused the transfer.

F-23

Table of Contents

As a result of the Acquisition, the Company evaluated the fair value of the assets acquired and the liabilities assumed. The Company recorded the oil and gas assets acquired in the Acquisition at the price paid. Prior to doing so, the Company determined that the price paid approximated the fair value of the net assets acquired. In doing so, the Company compared the price paid per BOE of existing production to comparable companies’ enterprise value per BOE of existing production. Additionally, the Company did an evaluation of the reserves acquired, based on varying percentages of the present value discounted at 10 percent (“PV-10”) of the different categories (PDP, PDNP and PUD) of the reserves. Based on these evaluations, we determined that the price paid was a reasonable approximation of the fair value of the oil and gas assets acquired. Given the significance of the unobservable nature of a number of the inputs, these are considered Level 3 on the fair value hierarchy.

The Company recorded the prepaid expenses, joint interest billing receivables and revenues payable at the carrying value assumed from Wishbone. The carrying amounts of receivables and accounts payable and other current assets and liabilities approximate fair value because of the short-term maturities and/or liquid nature of these assets and liabilities.

The fair values of the Company’s derivatives are not actively quoted in the open market. The Company uses a market approach to estimate the fair values of its derivative instruments on a recurring basis, utilizing commodity futures pricing for the underlying commodities provided by a reputable third party, a Level 2 fair value measurement.

The following table summarizes the valuation of our assets and liabilities that are measured at fair value on a recurring basis (further detail in Note 8).

Fair Value Measurement Classification

Quoted prices in

Active Markets

Significant

for Identical Assets

Significant Other

Unobservable

or (Liabilities)

Observable Inputs

Inputs


(Level 1)


(Level 2)


 (Level 3)


Total

As of December 31, 2020

Commodity Derivatives - Liabilities

$

$

(4,156,601)

$

$

(4,156,601)

Total

$

$

(4,156,601)

$

$

(4,156,601)

As of December 31, 2021

Commodity Derivatives - Liabilities

$

$

(29,241,588)

$

$

(29,241,588)

Total

$

$

(29,241,588)

$

$

(29,241,588)

F-24

Table of Contents

The carrying amounts reported for the revolving line of credit approximates fair value because the underlying instruments are at interest rates which approximate current market rates. The carrying amounts of receivables and accounts payable and other current assets and liabilities approximate fair value because of the short-term maturities and/or liquid nature of these assets and liabilities.

NOTE 10 – REVOLVING LINE OF CREDIT

On July 1, 2014, the Company entered into a Credit Agreement with SunTrust Bank, as lender, issuing bank and administrative agent for several banks and other financial institutions and lenders (the “Administrative Agent”), which was amended on June 14, 2018, May 18, 2016, July 24, 2015, and June 26, 2015. In April 2019, the Company amended and restated its Credit Agreement with the Administrative Agent (as amended and restated, the “Credit Facility”). The amendment and restatement of the Credit Facility, among other things, increased the maximum borrowing amount to $1 billion, extended the maturity date through April 2024 and made other modifications to the terms of the Credit Facility. This Credit Facility was amended on December 23, 2020 and June 17, 2020. The latest amendment adjusted the borrowing base to $350 million and made other modifications to the terms of the Credit Facility. The Credit Facility is secured by a first lien on substantially all of the Company’s assets.

The Borrowing Base is subject to periodic redeterminations, mandatory reductions and further adjustments from time to time. The Borrowing Base is redetermined semi-annually on each May 1 and November 1. The Borrowing Base is subject to reduction in certain circumstances such as the sale or disposition of certain oil and gas properties of the Company or its subsidiaries and cancellation of certain hedging positions.

The Credit Facility allows for Eurodollar Loans and Base Rate Loans (as respectively defined in the Credit Facility). The interest rate on each Eurodollar Loan will be the adjusted LIBOR for the applicable interest period plus a margin between 2.5% and 3.5% (depending on the then-current level of Borrowing Base usage). The annual interest rate on each Base Rate Loan is (a) the greatest of (i) the Administrative Agent’s prime lending rate, (ii) the Federal Funds Rate (as defined in the Credit Facility) plus 0.5% per annum, (iii) the adjusted LIBOR determined on a daily basis for an interest period of one-month, plus 1.00% per annum and (iv) 0.00% per annum, plus (b) a margin between 1.5% and 2.5% (depending on the then-current level of Borrowing Base usage).

The Credit Facility contains certain covenants, which, among other things, require the maintenance of (i) a total Leverage Ratio (outstanding debt to adjusted earnings before interest, taxes, depreciation and amortization) of not more than 4.0 to 1.0 and (ii) a minimum ratio of Current Assets to Current Liabilities (as such terms are defined in the Credit Facility) of 1.0 to 1.0. The amendment to the credit facility in June 2020 allowed for a Leverage Ratio of not greater than 4.75 to 1 as of the last day of the fiscal quarter ending September 30, 2020. The December 2020 amendment permitted a total Leverage Ratio not greater than 4.25 for the period ending March 31, 2021. The Credit Facility also contains other customary affirmative and negative covenants and events of default. As of December 31, 2021, $290,000,000 was outstanding on the Credit Facility. We are in compliance with all covenants contained in the Credit Facility.

F-25

Table of Contents

NOTE 11 – ASSET RETIREMENT OBLIGATION

A reconciliation of the asset retirement obligation for the years ended December 31, 2019, 2020 and 2021 is as follows:

Balance, December 31, 2018

$

13,055,797

Liabilities acquired

3,745,642

Liabilities incurred

631,727

Liabilities settled

(1,589,654)

Accretion expense

943,707

Balance, December 31, 2019

$

16,787,219

Liabilities incurred

99,436

Liabilities settled

(710,577)

Revision of estimate (1)

34,441

Accretion expense

906,616

Balance, December 31, 2020

$

17,117,135

Liabilities acquired

$

662,705

Liabilities incurred

171,390

Liabilities sold

(2,934,126)

Liabilities settled

(904,514)

Revision of estimate (1)

435,419

Accretion expense

744,045

Balance, December 31, 2021

$

15,292,054

(1) Several factors are considered in the annual review process, including current estimates for removal cost and estimated remaining useful life of the assets. The 2020 revision of estimates reflect an adjustment to the estimates for plugging costs. The 2021 revision of estimates primarily reflect updated interests for our working interest partners.

NOTE 12 – STOCKHOLDERS’ EQUITY

The Company is authorized to issue 225,000,000 shares of common stock, with a par value of $0.001 per share, and 50,000,000 shares of preferred stock with a par value per share of $0.001 per share.

Issuance of equity instruments in public and private offerings – In October 2020, the Company closed on an underwritten public offering of (i) 9,575,800 shares of common stock, (ii) 13,428,500 Pre-Funded Warrants and (iii) 23,004,300 warrants to purchase common stock (the “Common Warrants”) at a combined purchase price of $0.70. This includes a partial exercise of the over-allotment.  The Common Warrants have a term of five years and an exercise price of $0.80 per share. Gross proceeds totaled $16,089,582.

Concurrently with the underwritten public offering, the Company closed on a registered direct offering of (i) 3,500,000 shares of common stock, (ii) 3,300,000 Pre-Funded Warrants and (iii) 6,800,000 Common Warrants at a combined purchase price of $0.70 per share of common stock and Pre-Funded Warrants. The Common Warrants have a term of five years and an exercise price of $0.80 per share. Gross proceeds totaled $4,756,700.

Total gross proceeds from the 2020 underwritten public offering and the registered direct offering aggregated $20,846,282. Total net proceeds aggregated $19,379,832.

Common stock issued pursuant to warrant exercise - In December 2020, the Company issued 3,300,000 shares of common stock pursuant to the exercise of Pre-Funded Warrants issued in the October 2020 registered direct offering. Gross and net proceeds were $3,300. In January 2021, the remaining 13,428,500 Pre-Funded Warrants were exercised. During the year ended December 31, 2021, 442,600 of the Common Warrants were exercised. Accordingly, the number of Common Warrants outstanding as of December 31, 2021 was 29,361,700.

Common stock issued in property acquisition – As discussed in Note 5, in April 2019, the Company completed the acquisition of assets from Wishbone. As a part of the consideration for the acquisition, the Company issued 4,576,951 shares of common stock.

F-26

Table of Contents

The shares were valued at February 25, 2019, the date of the signing of the Purchase and Sale Agreement. The price on February 25, 2019 was $6.19 per share. The aggregate value of the shares issued, based on this price, was $28,331,327.

In April 2020, 16,702 shares of common stock were returned and cancelled as settlement of post-closing adjustments. The shares were valued at February 25, 2019, the date of the signing of the Purchase and Sale Agreement. The price on February 25, 2019 was $6.19 per share. The aggregate value of the shares returned, based on this price, was $103,385.

Common Stock Issued for option exercises – During the year ended December 31, 2021, the Company issued 100,000 shares of common stock as a result of stock option exercises. No stock options were exercised in 2019 or 2020. The following tables present the details of the 2021 exercises:


Stock price on


Aggregate value

Options

Exercise

Shares

Shares

Cash paid at

date of exercise

of shares retained

exercised

price ($)

issued

retained

exercise ($)

($)

($)

2021


100,000

$

2.00


100,000


$

200,000

$

3.14

$

2021 Totals


100,000


100,000


$

200,000

2021 Weighted Averages


$

2.00


$

3.14


NOTE 13 – EMPLOYEE STOCK OPTIONS, RESTRICTED STOCK AWARD PLAN AND 401(k)

In June 2020, officers and directors of the Company voluntarily returned stock options that had previously been granted to them. In total, 2,265,000 options with a weighted average exercise price of $6.87 per share were returned to and cancelled by the Company. No grants, cash payments or other consideration has been or will be made to replace the options or otherwise in connection with the return. As a result of the return and cancellation of the options, the Company incurred additional compensation expense of $768,379.

During October and December 2020, as a result of changes to the executive team and the Board of Directors (the “Board”) of the Company, the Company accelerated the vesting of 1,131,955 shares of restricted stock and as a result of such acceleration, the Company incurred additional compensation expense of $2,361,362.

Compensation expense charged against income for share-based awards during the years ended December 31, 2021, 2020, and 2019 was $2,418,323, $5,364,162,and $3,082,625, respectively. These amounts are included in general and administrative expense in the Statements of Operations.

In 2011, the Board approved and adopted a long-term incentive plan (the “2011 Plan”), which was subsequently approved and amended by the shareholders. There were 341,155 shares eligible for grant, either as stock options or as restricted stock, as of December 31, 2021.

In 2021, the Board approved and adopted The Omnibus Incentive Plan (the “2021 Plan”), which was subsequently approved and amended by the shareholders at the 2021 Annual Meeting. There were 7,814,128 shares eligible for grant, either as stock options or as restricted stock, as of December 31, 2021.

Employee Stock Options – No stock options have been granted in the years ended December 31, 2021, 2020, or 2019. All outstanding stock option awards vest at the rate of 20% each year over five years beginning one year from the date granted and expire ten years

F-27

Table of Contents

from the grant date. A summary of the status of the stock options as of December 31, 2021, 2020, and 2019 and changes during the years ended December 31, 2021, 2020, and 2019 is as follows:


2021


2020


2019

Weighted-

Weighted-

Weighted-

Average

Average

Average


Options


Exercise Price


Options


Exercise Price


Options


Exercise Price

Outstanding at beginning of the year


465,500

$

3.26


2,748,500

$

6.28


2,751,000

$

6.28

Issued


Forfeited or rescinded


(2,283,000)


6.89


(2,500)


11.70

Exercised


(100,000)


2.00


Outstanding at end of year


365,500

$

3.61


465,500

$

3.26


2,748,500

$

6.28

Exercisable at end of year


365,500

$

3.61


455,300

$

3.11


2,506,700

$

5.78

For the years ended December 31, 2021, 2020, and 2019 the Company incurred share-based compensation expense related to stock options of $20,934, $927,559, and $625,855, respectively. As of December 31, 2021, the Company had $0 of unrecognized compensation cost related to stock options. The aggregate intrinsic value of options vested and expected to vest as of December 31, 2021 was $82,600. The aggregate intrinsic value of options exercisable at December 31, 2021 was $82,600. The year-end intrinsic values are based on a December 31, 2021 closing stock price of $2.28.

Stock options exercised of 100,000 in 2021 had an aggregate intrinsic value on the date of exercise of $114,000. No stock options were exercised in 2020 or 2019.

The following table summarizes information related to the Company’s stock options outstanding as of December 31, 2021:

Options Outstanding


Weighted-


Average

Remaining

Number

Contractual Life

Number

Exercise price

Outstanding

(in years)

Exercisable

$

2.00

295,000


2.00


295,000

5.50

5,000


2.21


5,000

14.54

10,000


3.74


10,000

8.00

4,500


3.92


4,500

6.42

15,000


4.34


15,000

11.75

36,000


4.95


36,000

365,500

2.46


365,500

F-28

Table of Contents

Restricted stock grants – Following is a table reflecting the restricted stock grants during 2019, 2020 and 2021:

# of shares of

Grant date


restricted stock

April 9,2019


10,400

May 30, 2019

5,000

July 9,2019

5,000

September 13, 2019


10,000

December 21, 2019


627,205

October 1, 2020

900,000

October 26,2020

150,000

December 15,2020

930,000

April 30, 2021

33,950

June 17, 2021

1,162,152

July 6, 2021

11,824

July 12, 2021

4,007

September 1, 2021

10,417

September 8, 2021

3,306

Restricted stock grants prior to 2020 vest at the rate of 20% each year over five years beginning one year from the date granted. Restricted stock grants in 2020 and 2021 vest at a rate of 33% each year over three years beginning one year from the date granted for all employees; for members of the Company’s Board of Directors, the restricted stock grants vest on the earliest of (i) the day before the next shareholder meeting or (ii) the first anniversary of the date of the award. A summary of the status of restricted stock grants as of December 31, 2021 and 2020 and changes during the years ended December 31, 2021, 2020 and 2019 is as follows:

2021

2020


2019


Weighted-


Average


Grant

Weighted-


Weighted-

Date Fair

Average Grant


Average Grant


Restricted stock


Value


Restricted stock


Date Fair Value


Restricted stock


Date Fair Value

Outstanding at beginning of year


2,132,297


$

2.94


1,341,889


$

4.99

878,360

$

7.33

Granted


1,225,656


2.77


1,980,000


0.71

657,605

2.63

Forfeited or rescinded


(9,200)


3.97

(6,940)

4.23

Vested


(785,357)


1.37


(1,180,392)


4.97

(187,136)

7.79

Outstanding at end of year


2,572,596


$

1.75


2,132,297


$

2.94

1,341,889

$

4.99

For the years ended December 31, 2021, 2020 and 2019, the Company incurred share-based compensation expense related to restricted stock grants of $2,225,895, $4,436,603, and $2,456,770, respectively. As of December 31, 2021, the Company had $2,721,852 of unrecognized compensation cost related to restricted stock grants that will be recognized over a weighted average period of 2.02 years.

During 2021, 2020, and 2019, 785,357, 1,180,392, and 187,136 shares of restricted stock vested, respectively. At the dates of vesting those shares had an aggregate intrinsic value of $2,049,603, $801,133, and $494,605, respectively.

Performance Stock Units - In accordance with the 2021 Plan, as of November 22, 2021, the Company entered into performance stock unit (“PSU”) agreements (the “PSU Agreement”) with certain employees. Upon approval the Board, a total of 860,216 PSU were granted to the Company’s five executive officers (the “2021 PSU Awards”). The performance period for the 2021 PSU Awards began on January 1, 2021, and will end December 31, 2023, with such awards vesting on the last day of the performance period (the vesting date). The PSUs are performance-based restricted stock units subject to the terms of the 2021 Plan and the PSU Agreement. A summary of the status of the performance stock grants as of December 31, 2021 and changes during the year ended December 31, 2021 is as follows:


2021

Weighted-

Average 

Performance

Grant Date 


Stock Units


Fair Value

Outstanding at beginning of year


$

Granted


860,216


3.87

F-29

Table of Contents

Forfeited or rescinded


Vested


Outstanding at end of year


860,216

$

3.87

For the year ended December 31, 2021, the Company incurred share-based compensation expense related to the 2021 PSU Awards of $171,494. As of December 31, 2021, the Company had $3,348,851 of unrecognized compensation cost related to the 2021 PSU Awards that will be recognized over a weighted average period of 2 years.

401(k) Plan- In 2019, the Company initiated a sponsored 401(k) plan that is a defined contribution plan for the benefit of all eligible employees. The plan allows eligible employees, after a three-month waiting period, to make pre-tax or after-tax contributions, not to exceed annual limits established by the federal government. The Company makes matching contributions of up to 6% of any employee’s compensation. Employees are 100% vested in the employer contribution upon receipt.

The following table presents the matching contributions expense recognized for the Company’s 401(k) plan for the years ended December 31, 2021, 2020, and 2019.


2021


2020


2019

Employer safe harbor match

228,273

138,977


59,716

NOTE 14 – RELATED PARTY TRANSACTIONS

The Company leased office space in Tulsa, Oklahoma, from Arenaco, LLC (“Arenaco”), a company that is owned by two stockholders of the Company, Mr. Rochford, former Chairman of the Board, and Mr. McCabe, a former Director of the Company. During the years ended December 31, 2021, 2020, and 2019, the Company paid $10,000, $60,000, and $60,000, respectively, to Arenaco.  The month-to-month Arenaco lease was terminated as of March 31, 2021.

During June 2021, the Company began using Pro-Ject Chemicals, LLC (“PJ Chemicals”) to perform various chemical services on its wells. As publicly disclosed on the Company’s website, Paul D. McKinney, Chief Executive Officer and Chairman of the Board, is a member of the board of directors of Pro-Ject Holdings, LLC, a privately owned oil field chemical services company and parent of PJ Chemicals. Mr. McKinney owns .34% of the shares of Pro-Ject Holdings, LLC. During the year ended December 31, 2021, the Company paid $117,830 to PJ Chemicals. As of December 31, 2021 the Company had accounts payable of $37,641 due to PJ Chemicals.

NOTE 15 – COMMITMENTS AND CONTINGENT LIABILITIES

Standby Letters of Credit – A commercial bank issued standby letters of credit on behalf of the Company totaling $260,000 to state and federal agencies and $500,438 to an insurance company to secure the surety bonds described below. The standby letters of credit are valid until cancelled or matured and are collateralized by the revolving credit facility with the bank. The terms of the letters of credit to the state and federal agencies are extended for a term of one year at a time. The Company intends to renew the standby letters of credit to the state and federal agencies for as long as the Company does business in the States of Texas and New Mexico. The letters of credit to the insurance company will be renewed if the insurance requires them to retain the surety bonds. No amounts have been drawn under the standby letters of credit.

Surety Bonds – An insurance company issued surety bonds on behalf of the Company totaling $500,438 to various State of New Mexico agencies in order for the Company to do business in the State of New Mexico. The surety bonds are valid until canceled or matured. The terms of the surety bonds are extended for a term of one year at a time. The Company intends to renew the surety bonds on $400,000 as long as the Company does business in the State of New Mexico. The remaining $100,438 will require renewal until the two subject wells are plugged.

F-30

Table of Contents

NOTE 16 – INCOME TAXES

For the years ended December 31, 2021, 2020, and 2019, components of our provision for income taxes are as follows:

Provision for Income Taxes


2021


2020


2019

Federal Deferred Tax

$

$

(6,001,176)

$

13,787,654

State Deferred Tax

90,342

Provision for Income Taxes

$

90,342

$

(6,001,176)

$

13,787,654

The following is a reconciliation of income taxes computed using the U.S. federal statutory rate to the provision for income taxes:

Rate Reconciliation


2021


2020


2019

Pre-tax book income

$

3,413,234

$

(259,413,004)

$

43,284,205

Tax at federal statutory rate

$

716,779

$

(54,476,731)

$

9,089,683

Excess tax benefit from stock option exercises and restricted stock vesting

(175,187)


(1,109,379)


4,055,418

Adjust prior estimates to tax return

2,938,948


(1,930,994)


19

States taxes, net of federal benefit

430,654


(964,393)


160,913

Adjustment for change in future effective tax rate (1)


479,222

Valuation allowance

(3,827,194)

52,161,412

Non-deductible expenses and other

6,342

318,909

2,399

Provision for Income Taxes

$

90,342

$

(6,001,176)

$

13,787,654

(1)The acquisition of the Northwest Shelf assets from Wishbone included properties in the State of New Mexico. The tax rates associated with the State of New Mexico adjusted our overall tax rate from 21% to 21.29%. This resulted in an additional tax expense during the year ended December 31, 2019 of $479,222.

The net deferred taxes consisted of the following as of December 31, 2021 and 2020:


12/31/2021


12/31/2020

Total

Total

Deferred Tax Assets


Net operating loss (NOL) carryforward

60,155,112

54,185,183

Equity compensation

691,076

3,350,361

Asset retirement obligation

3,348,875

4,604,906

Fair market value of derivatives

6,403,745

888,266

Accrued expense

5,049

Others


56,028


55,746

Gross Deferred Tax Assets


70,659,885


63,084,462

Less: valuation allowance


(48,334,217)


(52,161,412)

Net Deferred Tax Assets


22,325,668


10,923,050

Deferred Tax Liabilities


Propety and equipment


(22,415,959)


(10,923,050)

Net Deferred Liabilties


(22,415,959)


(10,923,050)

Net Deferred Tax Asset/(Liabilities)


(90,292)


Note that the presentation of the December 31, 2020 income tax, rate reconciliation and deferred tax tables have been adjusted to conform to current year presentation. The total income tax expense, net deferred tax asset and deferred tax liability balances remain the same as prior year.

As of December 31, 2021, the Company had net operating loss carryforwards for federal income tax reporting purposes of approximately $108.9 million which, if unused, will begin to expire in 2027 and fully expire in 2037 and an additional $176.7 million that can be carried forward indefinitely. Because of the change in ownership provisions of the Code, use of a portion of our federal NOLs may be limited in future periods. As of December 31, 2021, we carried a valuation allowance against our federal and state deferred tax assets of $48,334,217. We have considered both the positive and negative evidence in determining whether it was more likely than not that some portion or all of our deferred tax assets will be realized. The amount of deferred tax assets considered

F-31

Table of Contents

realizable could, however, be adjusted if estimates of future taxable income during the carryforward period are reduced or increased or if objective negative evidence is no longer present and additional weight is given to subjective positive evidence, including projections for growth. The valuation allowance along with $22,415,959 of deferred tax liabilities bring our net deferred position to a deferred tax liability of $90,292. The net deferred tax liability recognized on our balance sheet as of December 31, 2021 is attributable to certain state deferred tax liabilities associated with property and equipment.

NOTE 17 – LEGAL MATTERS

The Company is a defendant in a lawsuit in Harris County District Court, Houston, Texas, styled EPUS Permian Assets, LLC, v. Ring Energy, Inc., that was filed in July 2021. The plaintiff, EPUS Permian Assets, LLC, claims breach of contract, money had and received by fraudulent inducement, unjust enrichment and constructive trust. The plaintiff is requesting its forfeited deposit of $5,500,000 in connection with a proposed property sale by the Company plus related damages, and attorneys’ fees and costs. The action relates to a proposed property sale by the Company to the plaintiff, which was extended by the Company on several occasions with the plaintiff ultimately failing to perform on the agreement and the Company keeping the deposit. The Company believes that the claims by the plaintiff are entirely without merit and is conducting a vigorous defense and counterclaim. The Company has filed an answer and a counterclaim denying the allegations and asserting affirmative defenses that would bar or substantially limit the plaintiff’s claims, asserting breach of contract and requesting a declaratory judgment and attorneys’ fees and costs. The parties are conducting discovery.

NOTE 18 – SUBSEQUENT EVENTS

Effective February 1, 2022, the Company entered into a derivative contract with its lender for 1,000 barrels of oil per day for the remainder of 2022 (total notional quantity of 334,000 barrels). Fixed swap prices range vary by month, ranging from $90.78 per barrel in February to $80.01 per barrel by the end of the year, with a weighted average swap price of $84.61 per barrel.

F-32

Table of Contents

RING ENERGY, INC.

SUPPLEMENTAL INFORMATION ON OIL AND NATURAL GAS PRODUCING ACTIVITIES

(Unaudited)

Results of Operations from Oil and Natural Gas Producing Activities – The Company’s results of operations from oil and natural gas producing activities exclude interest expense, gain from change in fair value of derivatives, and other financing expense.

For the years ended December 31, 


2021


2020


2019

Oil and natural gas sales

$

196,305,966

$

113,025,138

$

195,702,831

Lease operating expenses

(30,312,399)

(29,753,413)

(42,213,006)

Gathering, transportation and processing costs

(4,333,232)

(4,090,238)

(2,874,155)

Ad valorem taxes

(2,276,463)

(3,125,222)

(3,409,064)

Production taxes

(9,123,420)


(5,228,090)


(9,130,379)

Depreciation, depletion, amortization and accretion

(37,167,967)


(43,010,660)


(56,204,269)

Ceiling test impairment


(277,501,943)


General and administrative (exclusive of corporate overhead)

(2,003,876)


(1,454,041)


(5,696,189)

Results of Oil and Natural Gas Producing Operations

$

111,088,609

$

(251,138,469)

$

76,175,769

Net Costs Incurred in Oil and Gas Producing Activities

For the years Ended December 31,


2021


2020

Payments to purchase oil and natural gas properties

$

1,368,437

$

1,317,313

Proceeds from divestiture of oil and natural gas properties


(2,000,000)


Payments to develop oil and natural gas properties


51,302,131


42,457,745

Payments to acquire or improve fixed assets subject to depreciation


568,832


55,339

Total Net Costs Incurred

$

51,239,400

$

43,830,397

Net Capitalized Costs

As of December 31,


2021


2020

Oil and natural gas properties, full cost method

$

883,844,745

$

836,514,815

Financing lease asset subject to depreciation


1,422,487


858,513

Fixed assets subject to depreciation


2,089,722


1,520,890

Total Properties and Equipment


887,356,954


838,894,218

Accumulated depletion, depreciation and amortization


(235,997,307)


(200,111,658)

Net Properties and Equipment

$

651,359,647

$

638,782,560

Reserve Quantities Information – The following estimates of proved and proved developed reserve quantities and related standardized measure of discounted future net cash flow are estimates only, and do not purport to reflect realizable values or fair market values of the Company’s reserves. The Company emphasizes that reserve estimates are inherently imprecise and that estimates of new discoveries are more imprecise than those of producing oil and natural gas properties. Accordingly, these estimates are expected to change as future information becomes available. All of the Company’s reserves are located in the United States of America.


The proved reserves estimates shown herein for the years ended December 31, 2021, 2020 and 2019 have been prepared by Cawley, Gillespie & Associates, Inc., independent petroleum engineers. Proved reserves were estimated in accordance with guidelines established by the SEC, which require that reserve estimates be prepared under existing economic and operating conditions based upon the 12-month unweighted average of the first-day-of-the-month prices.

The reserve information in these Consolidated Financial Statements represents only estimates. There are a number of uncertainties inherent in estimating quantities of proved reserves, including many factors beyond the Company’s control, such as commodity pricing. Reserve engineering is a subjective process of estimating underground accumulations of oil and natural gas that cannot be measured in an exact manner. The accuracy of any reserve estimate is a function of the quality of available data and engineering and geological interpretation and judgment. As a result, estimates by different engineers may vary. In addition, results of drilling, testing and production subsequent to the date of an estimate may lead to revising the original estimate. Accordingly, initial reserve estimates are often different from the quantities of oil and natural gas that are ultimately recovered. The meaningfulness of such

F-33

Table of Contents

estimates depends primarily on the accuracy of the assumptions upon which they were based. Except to the extent the Company acquires additional properties containing proved reserves or conducts successful exploration and development activities or both, the Company’s proved reserves will decline as reserves are produced.

The oil prices as of December 31, 2021, 2020 and 2019 are based on the respective 12-month unweighted average of the first of the month prices of the West Texas Intermediate (“WTI”) spot prices which equates to $63.04 per barrel, $36.04 per barrel and $52.19 per barrel, respectively. The natural gas prices as of December 31, 2021, 2020 and 2019 are based on the respective 12-month unweighted average of the first of month prices of the Henry Hub spot price which equates to $3.598 per MMBtu, $1.99 per MMBtu and $2.58 per MMBtu, respectively. Prices are adjusted by local field and lease level differentials and are held constant for life of reserves in accordance with SEC guidelines.  

Proved reserves are estimated reserves of crude oil (including condensate and natural gas liquids) and natural gas that geological and engineering data demonstrate with reasonable certainty to be recoverable in future years from known reservoirs under existing economic and operating conditions. Proved developed reserves are those expected to be recovered through existing wells, equipment and methods.


For the Year Ended December 31, 

2021

2020


Oil (1)


Natural Gas (1)


Oil (1)


Natural Gas (1)

Proved Developed and Undeveloped Reserves


Beginning of year


66,264,286

61,305,027

71,359,014


58,271,882

Purchases of minerals in place


2,180,497

824,512


Extensions, discoveries and improved recovery


3,975,675

5,172,392

3,495,210


1,824,310

Sale of minerals in place


(462,970)

(555,879)


Production


(2,686,940)

(2,535,188)

(2,801,528)


(2,494,501)

Revisions of previous quantity estimates


(3,431,939)

7,562,925

(5,788,410)


3,703,336


End of year


65,838,609

71,773,789

66,264,286


61,305,027


Proved Developed at beginning of year


38,260,639

34,335,520

41,242,050


33,467,870

Proved Undeveloped at beginning of year


28,003,648

26,969,507

30,116,964


23,804,012


Proved Developed at end of year


36,820,822

39,748,902

38,260,639


34,335,520

Proved Undeveloped at end of year


29,017,787

32,024,887

28,003,648


26,969,507

1 Oil reserves are stated in barrels; natural gas reserves are stated in thousand cubic feet.

Revisions represent changes in previous reserves estimates, either upward or downward, resulting from new information normally obtained from development drilling and production history or resulting from a change in economic factors, such as commodity prices, operating costs or development costs.

During the year ended December 31, 2021, the Company’s extensions and discoveries of 4,838 MBOE resulted primarily from new proved undeveloped locations resulting from the 2021 operated drilling program in the Northwest Shelf and Central Basin Platform as well as non-operated activity in the Northwest Shelf. Negative revisions of 2,172 MBOE were the result of Delaware PUD removal due to the 5 Year Rule, well performance, and increased cost from 2021 industry activity increase partially offset by commodity price increases.

The increase in proved undeveloped reserves was primarily attributable to extensions of 4,110 MBOE resulting primarily from the 2021 operated drilling program in the Northwest Shelf and Central Basin Platform as well as non-operated activity in the Northwest Shelf.

Standardized Measure of Discounted Future Net Cash Flows – The standardized measure of discounted future net cash flows is computed by applying the price according to the SEC guidelines for oil and natural gas to the estimated future production of proved oil and natural gas reserves, less estimated future expenditures (based on year-end costs) to be incurred in developing and producing the proved reserves, less estimated future income tax expenses (based on year-end statutory tax rates) to be incurred on pretax net cash flows less tax basis of the properties and available credits, and assuming continuation of existing economic conditions. The estimated future net cash flows are then discounted using a rate of 10 percent per year to reflect the estimated timing of the future cash flows.

Standardized Measure of Discounted Future Net Cash Flows

F-34

Table of Contents

December 31, 


2021


2020


2019

Future cash inflows

$

4,853,709,000

$

2,682,488,655

$

3,825,773,515

Future production costs

(1,395,437,250)


(821,515,126)


(964,887,856)

Future development costs

(347,757,000)


(244,323,270)


(252,457,833)

Future income taxes

(501,586,949)


(208,645,934)


(424,715,966)

Future net cash flows

2,608,927,801


1,408,004,325


2,183,711,860

10% annual discount for estimated timing of cash flows

(1,471,562,953)


(852,133,072)


(1,260,536,809)


Standardized Measure of Discounted Future Net Cash Flows

$

1,137,364,848

$

555,871,253

$

923,175,051

The following is a summary of the changes in the Standardized Measure for the Company’s proved oil and natural gas reserves during each of the years in the three-year period ended December 31, 2021:

Changes in Standardized Measure of Discounted Future Net Cash Flows


2021


2020


2019

Beginning of the year

$

555,871,253

$

923,175,051

$

455,944,641

Purchase of minerals in place


33,688,718


598,489,190

Extensions, discoveries and improved recovery


79,003,885


61,303,074


334,641,933

Development costs incurred during the year


17,513,180


29,916,746


152,125,320

Sales of oil and gas produced, net of production costs


(154,615,685)


(70,634,853)


(137,663,314)

Sales of minerals in place


(2,523,746)


(30,174,528)

Accretion of discount


63,810,764


92,838,323


47,463,292

Net changes in price and production costs


636,884,944


(368,974,767)


(219,608,128)

Net change in estimated future development costs


(44,357,751)


(3,883,985)


47,617,158

Revisions of previous quantity estimates


(22,259,508)


(66,213,586)


(126,143,669)

Changes in estimated timing of cash flows


86,845,188


(139,039,115)


(107,443,484)

Net change in income taxes


(112,496,394)


97,384,365


(92,073,360)

End of the Year

$

1,137,364,848

$

555,871,253

$

923,175,051

F-35